Wells Fargo 2011 Annual Report Download - page 198
Download and view the complete annual report
Please find page 198 of the 2011 Wells Fargo annual report below. You can navigate through the pages in the report by either clicking on the pages listed below, or by using the keyword search tool below to find specific information within the annual report.-
 1
1 -
2
-
3
-
4
-
5
-
6
-
7
-
8
-
9
-
10
-
11
-
12
-
13
-
14
-
15
-
16
-
17
-
18
-
19
-
20
-
21
-
22
-
23
-
24
-
25
-
26
-
27
-
28
-
29
-
30
-
31
-
32
-
33
-
34
-
35
-
36
-
37
-
38
-
39
-
40
-
41
-
42
-
43
-
44
-
45
-
46
-
47
-
48
-
49
-
50
-
51
-
52
-
53
-
54
-
55
-
56
-
57
-
58
-
59
-
60
-
61
-
62
-
63
-
64
-
65
-
66
-
67
-
68
-
69
-
70
-
71
-
72
-
73
-
74
-
75
-
76
-
77
-
78
-
79
-
80
-
81
-
82
-
83
-
84
-
85
-
86
-
87
-
88
-
89
-
90
-
91
-
92
-
93
-
94
-
95
-
96
-
97
-
98
-
99
-
100
-
101
-
102
-
103
-
104
-
105
-
106
-
107
-
108
-
109
-
110
-
111
-
112
-
113
-
114
-
115
-
116
-
117
-
118
-
119
-
120
-
121
-
122
-
123
-
124
-
125
-
126
-
127
-
128
-
129
-
130
-
131
-
132
-
133
-
134
-
135
-
136
-
137
-
138
-
139
-
140
-
141
-
142
-
143
-
144
-
145
-
146
-
147
-
148
-
149
-
150
-
151
-
152
-
153
-
154
-
155
-
156
-
157
-
158
-
159
-
160
-
161
-
162
-
163
-
164
-
165
-
166
-
167
-
168
-
169
-
170
-
171
-
172
-
173
-
174
-
175
-
176
-
177
-
178
-
179
-
180
-
181
-
182
-
183
-
184
-
185
-
186
-
187
-
 188
188 -
 189
189 -
 190
190 -
 191
191 -
 192
192 -
 193
193 -
 194
194 -
 195
195 -
 196
196 -
 197
197 -
 198
198 -
 199
199 -
 200
200 -
 201
201 -
 202
202 -
 203
203 -
 204
204 -
 205
205 -
 206
206 -
 207
207 -
 208
208 -
209
-
210
-
211
-
212
-
213
-
214
-
215
-
216
-
217
-
218
-
219
-
220
-
221
-
222
-
223
-
224
-
225
-
226
-
227
-
228
-
229
-
230
-
231
-
232
-
233
-
234
-
235
-
236
-
237
-
238
-
239
-
240
 |
 |

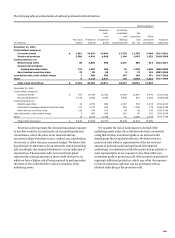
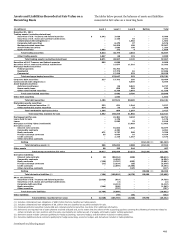
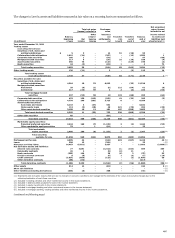
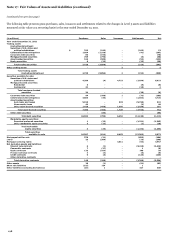
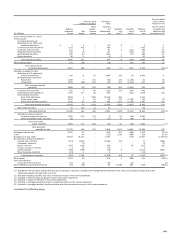
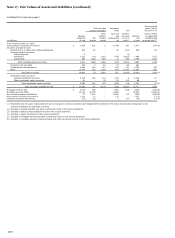
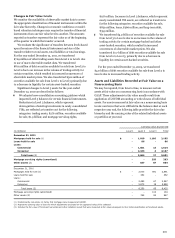
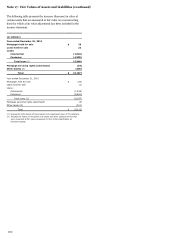
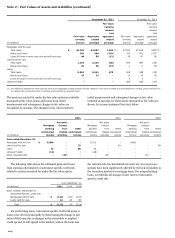
Note 17: Fair Values of Assets and Liabilities (continued)
(continued from previous page)
(in millions)
Level 1
Level 2
Level 3
Netting
Total
December 31, 2010
Trading assets (excluding derivatives)
Securities of U.S. Treasury and federal agencies
$
1,340
3,335
-
-
4,675
Securities of U.S. states and political subdivisions
-
1,893
5
-
1,898
Collateralized debt obligations (1)
-
-
1,915
-
1,915
Corporate debt securities
-
10,164
166
-
10,330
Mortgage-backed securities
-
9,137
117
-
9,254
Asset-backed securities
-
1,811
366
-
2,177
Equity securities
2,143
625
34
-
2,802
Total trading securities
3,483
26,965
2,603
-
33,051
Other trading assets
816
987
136
-
1,939
Total trading assets (excluding derivatives)
4,299
27,952
2,739
-
34,990
Securities of U.S. Treasury and federal agencies
938
666
-
-
1,604
Securities of U.S. states and political subdivisions
-
14,090
4,564
-
18,654
Mortgage-backed securities:
Federal agencies
-
82,037
-
-
82,037
Residential
-
20,183
20
-
20,203
Commercial
-
13,337
217
-
13,554
Total mortgage-backed securities
-
115,557
237
-
115,794
Corporate debt securities
-
9,846
433
-
10,279
Collateralized debt obligations (2)
-
-
4,778
-
4,778
Asset-backed securities:
Auto loans and leases
-
223
6,133
-
6,356
Home equity loans
-
998
112
-
1,110
Other asset-backed securities
-
5,285
3,150
-
8,435
Total asset-backed securities
-
6,506
9,395
-
15,901
Other debt securities
-
370
85
-
455
Total debt securities
938
147,035
19,492
-
167,465
Marketable equity securities:
Perpetual preferred securities (3)
721
677
2,434
-
3,832
Other marketable equity securities
1,224
101
32
-
1,357
Total marketable equity securities
1,945
778
2,466
-
5,189
Total securities available for sale
2,883
147,813
21,958
-
172,654
Mortgages held for sale
-
44,226
3,305
-
47,531
Loans held for sale
-
873
-
-
873
Loans
-
-
309
-
309
Mortgage servicing rights (residential)
-
-
14,467
-
14,467
Derivative assets:
Interest rate contracts
-
67,380
869
-
68,249
Commodity contracts
-
4,133
-
-
4,133
Equity contracts
511
2,040
721
-
3,272
Foreign exchange contracts
42
4,257
51
-
4,350
Credit contracts
-
2,148
3,198
-
5,346
Other derivative contracts
8
-
-
-
8
Netting
-
-
-
(63,469)
(4)
(63,469)
Total derivative assets (5)
561
79,958
4,839
(63,469)
21,889
Other assets
38
45
314
-
397
Total assets recorded at fair value
$
7,781
300,867
47,931
(63,469)
293,110
Derivative liabilities:
Interest rate contracts
$
(7)
(62,769)
(792)
-
(63,568)
Commodity contracts
-
(3,917)
(1)
-
(3,918)
Equity contracts
(259)
(2,291)
(946)
-
(3,496)
Foreign exchange contracts
(69)
(3,351)
(42)
-
(3,462)
Credit contracts
-
(2,199)
(4,215)
-
(6,414)
Other derivative contracts
-
-
(35)
-
(35)
Netting
-
-
-
70,009
(4)
70,009
Total derivative liabilities (6)
(335)
(74,527)
(6,031)
70,009
(10,884)
Short sale liabilities:
Securities of U.S. Treasury and federal agencies
(2,827)
(1,129)
-
-
(3,956)
Corporate debt securities
-
(3,798)
-
-
(3,798)
Equity securities
(1,701)
(178)
-
-
(1,879)
Other securities
-
(347)
-
-
(347)
Total short sale liabilities
(4,528)
(5,452)
-
-
(9,980)
Other liabilities
-
(36)
(344)
-
(380)
Total liabilities recorded at fair value
$
(4,863)
(80,015)
(6,375)
70,009
(21,244)
(1) Includes collateralized loan obligations of $671 million that are classified as trading assets.
(2) Includes collateralized loan obligations of $4.2 billion that are classified as securities available for sale.
(3) Perpetual preferred securities include ARS and corporate preferred securities. See Note 8 for additional information.
(4) Derivatives are reported net of cash collateral received and paid and, to the extent that the criteria of the accounting guidance covering the offsetting of amounts related to
certain contracts are met, positions with the same counterparty are netted as part of a legally enforceable master netting agreement.
(5) Derivative assets include contracts qualifying for hedge accounting, economic hedges, and derivatives included in trading assets.
(6) Derivative liabilities include contracts qualifying for hedge accounting, economic hedges and derivatives included in trading liabilities.
196