Wells Fargo 2011 Annual Report Download - page 160
Download and view the complete annual report
Please find page 160 of the 2011 Wells Fargo annual report below. You can navigate through the pages in the report by either clicking on the pages listed below, or by using the keyword search tool below to find specific information within the annual report.-
 1
1 -
2
-
3
-
4
-
5
-
6
-
7
-
8
-
9
-
10
-
11
-
12
-
13
-
14
-
15
-
16
-
17
-
18
-
19
-
20
-
21
-
22
-
23
-
24
-
25
-
26
-
27
-
28
-
29
-
30
-
31
-
32
-
33
-
34
-
35
-
36
-
37
-
38
-
39
-
40
-
41
-
42
-
43
-
44
-
45
-
46
-
47
-
48
-
49
-
50
-
51
-
52
-
53
-
54
-
55
-
56
-
57
-
58
-
59
-
60
-
61
-
62
-
63
-
64
-
65
-
66
-
67
-
68
-
69
-
70
-
71
-
72
-
73
-
74
-
75
-
76
-
77
-
78
-
79
-
80
-
81
-
82
-
83
-
84
-
85
-
86
-
87
-
88
-
89
-
90
-
91
-
92
-
93
-
94
-
95
-
96
-
97
-
98
-
99
-
100
-
101
-
102
-
103
-
104
-
105
-
106
-
107
-
108
-
109
-
110
-
111
-
112
-
113
-
114
-
115
-
116
-
117
-
118
-
119
-
120
-
121
-
122
-
123
-
124
-
125
-
126
-
127
-
128
-
129
-
130
-
131
-
132
-
133
-
134
-
135
-
136
-
137
-
138
-
139
-
140
-
141
-
142
-
143
-
144
-
145
-
146
-
147
-
148
-
149
-
 150
150 -
 151
151 -
 152
152 -
 153
153 -
 154
154 -
 155
155 -
 156
156 -
 157
157 -
 158
158 -
 159
159 -
 160
160 -
 161
161 -
 162
162 -
 163
163 -
 164
164 -
 165
165 -
 166
166 -
 167
167 -
 168
168 -
 169
169 -
 170
170 -
171
-
172
-
173
-
174
-
175
-
176
-
177
-
178
-
179
-
180
-
181
-
182
-
183
-
184
-
185
-
186
-
187
-
188
-
189
-
190
-
191
-
192
-
193
-
194
-
195
-
196
-
197
-
198
-
199
-
200
-
201
-
202
-
203
-
204
-
205
-
206
-
207
-
208
-
209
-
210
-
211
-
212
-
213
-
214
-
215
-
216
-
217
-
218
-
219
-
220
-
221
-
222
-
223
-
224
-
225
-
226
-
227
-
228
-
229
-
230
-
231
-
232
-
233
-
234
-
235
-
236
-
237
-
238
-
239
-
240
 |
 |

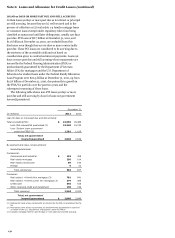
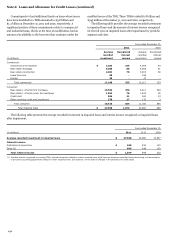
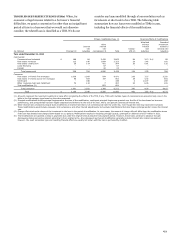
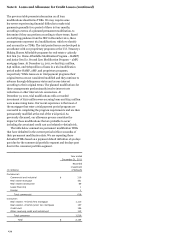
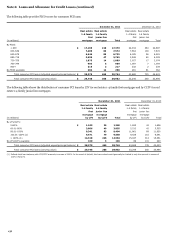
Note 6: Loans and Allowance for Credit Losses (continued)
The following table provides FICO scores for consumer PCI loans.
December 31, 2011
December 31, 2010
Real estate
Real estate
Real estate
Real estate
1-4 family
1-4 family
1-4 family
1-4 family
first
junior lien
first
junior lien
(in millions)
mortgage
mortgage
Total
mortgage
mortgage
Total
By FICO:
< 600
$
17,169
210
17,379
22,334
363
22,697
600-639
7,489
83
7,572
7,563
109
7,672
640-679
6,646
89
6,735
6,185
96
6,281
680-719
3,698
47
3,745
3,949
60
4,009
720-759
1,875
14
1,889
2,057
17
2,074
760-799
903
6
909
1,087
7
1,094
800+
215
2
217
232
2
234
No FICO available
284
14
298
281
81
362
Total consumer PCI loans (adjusted unpaid principal balance)
$
38,279
465
38,744
43,688
735
44,423
Total consumer PCI loans (carrying value)
$
29,746
206
29,952
33,245
250
33,495
The following table shows the distribution of consumer PCI loans by LTV for real estate 1-4 family first mortgages and by CLTV for real
estate 1-4 family junior lien mortgages.
December 31, 2011
December 31, 2010
Real estate
Real estate
Real estate
Real estate
1-4 family
1-4 family
1-4 family
1-4 family
first
junior lien
first
junior lien
mortgage
mortgage
mortgage
mortgage
(in millions)
by LTV
by CLTV
Total
by LTV
by CLTV
Total
By LTV/CLTV:
0-60%
$
1,243
25
1,268
1,653
43
1,696
60.01-80%
3,806
49
3,855
5,513
42
5,555
80.01-100%
9,341
63
9,404
11,861
89
11,950
100.01-120% (1)
9,471
79
9,550
9,525
116
9,641
> 120% (1)
14,318
246
14,564
15,047
314
15,361
No LTV/CLTV available
100
3
103
89
131
220
Total consumer PCI loans (adjusted unpaid principal balance)
$
38,279
465
38,744
43,688
735
44,423
Total consumer PCI loans (carrying value)
$
29,746
206
29,952
33,245
250
33,495
(1) Reflects total loan balances with LTV/CLTV amounts in excess of 100%. In the event of default, the loss content would generally be limited to only the amount in excess of
100% LTV/CLTV.
158