Wells Fargo 2011 Annual Report Download - page 37
Download and view the complete annual report
Please find page 37 of the 2011 Wells Fargo annual report below. You can navigate through the pages in the report by either clicking on the pages listed below, or by using the keyword search tool below to find specific information within the annual report.-
 1
1 -
2
-
3
-
4
-
5
-
6
-
7
-
8
-
9
-
10
-
11
-
12
-
13
-
14
-
15
-
16
-
17
-
18
-
19
-
20
-
21
-
22
-
23
-
24
-
25
-
26
-
 27
27 -
 28
28 -
 29
29 -
 30
30 -
 31
31 -
 32
32 -
 33
33 -
 34
34 -
 35
35 -
 36
36 -
 37
37 -
 38
38 -
 39
39 -
 40
40 -
 41
41 -
 42
42 -
 43
43 -
 44
44 -
 45
45 -
 46
46 -
 47
47 -
48
-
49
-
50
-
51
-
52
-
53
-
54
-
55
-
56
-
57
-
58
-
59
-
60
-
61
-
62
-
63
-
64
-
65
-
66
-
67
-
68
-
69
-
70
-
71
-
72
-
73
-
74
-
75
-
76
-
77
-
78
-
79
-
80
-
81
-
82
-
83
-
84
-
85
-
86
-
87
-
88
-
89
-
90
-
91
-
92
-
93
-
94
-
95
-
96
-
97
-
98
-
99
-
100
-
101
-
102
-
103
-
104
-
105
-
106
-
107
-
108
-
109
-
110
-
111
-
112
-
113
-
114
-
115
-
116
-
117
-
118
-
119
-
120
-
121
-
122
-
123
-
124
-
125
-
126
-
127
-
128
-
129
-
130
-
131
-
132
-
133
-
134
-
135
-
136
-
137
-
138
-
139
-
140
-
141
-
142
-
143
-
144
-
145
-
146
-
147
-
148
-
149
-
150
-
151
-
152
-
153
-
154
-
155
-
156
-
157
-
158
-
159
-
160
-
161
-
162
-
163
-
164
-
165
-
166
-
167
-
168
-
169
-
170
-
171
-
172
-
173
-
174
-
175
-
176
-
177
-
178
-
179
-
180
-
181
-
182
-
183
-
184
-
185
-
186
-
187
-
188
-
189
-
190
-
191
-
192
-
193
-
194
-
195
-
196
-
197
-
198
-
199
-
200
-
201
-
202
-
203
-
204
-
205
-
206
-
207
-
208
-
209
-
210
-
211
-
212
-
213
-
214
-
215
-
216
-
217
-
218
-
219
-
220
-
221
-
222
-
223
-
224
-
225
-
226
-
227
-
228
-
229
-
230
-
231
-
232
-
233
-
234
-
235
-
236
-
237
-
238
-
239
-
240
 |
 |

2009
2008
2007
Interest
Interest
Interest
Average
Yields/
income/
Average
Yields/
income/
Average
Yields/
income/
balance
rates
expense
balance
rates
expense
balance
rates
expense
$
26,869
0.56
%
$
150
5,293
1.71
%
$
90
4,468
4.99
%
$
223
21,092
4.48
944
4,971
3.80
189
4,291
4.37
188
2,436
2.83
69
1,065
3.84
41
851
4.26
36
13,098
6.42
840
7,329
6.83
501
4,643
7.37
342
84,295
5.45
4,591
43,968
5.97
2,623
38,181
6.10
2,328
45,672
9.09
4,150
23,357
6.04
1,412
6,524
6.12
399
129,967
6.73
8,741
67,325
5.99
4,035
44,705
6.10
2,727
32,022
7.16
2,291
13,956
7.17
1,000
6,343
7.52
477
177,523
6.73
11,941
89,675
6.22
5,577
56,542
6.34
3,582
37,416
5.16
1,930
25,656
6.13
1,573
33,066
6.50
2,150
6,293
2.90
183
837
5.69
48
896
7.76
70
180,924
4.22
7,643
98,620
6.12
6,034
77,965
8.17
6,367
96,273
3.50
3,365
41,659
5.80
2,416
32,722
7.38
2,414
40,885
2.91
1,190
19,453
5.08
988
16,934
7.80
1,321
14,751
9.32
1,375
7,141
5.62
401
5,921
5.84
346
30,661
3.95
1,212
7,127
10.50
748
7,321
11.68
855
363,494
4.07
14,785
174,000
6.08
10,587
140,863
8.02
11,303
238,359
5.45
12,992
75,116
6.67
5,008
61,527
7.25
4,463
106,957
4.76
5,089
75,375
6.55
4,934
72,075
8.12
5,851
23,357
12.16
2,841
19,601
12.13
2,378
15,874
13.58
2,155
90,666
6.56
5,952
54,368
8.72
4,744
54,436
9.71
5,285
459,339
5.85
26,874
224,460
7.60
17,064
203,912
8.71
17,754
822,833
5.06
41,659
398,460
6.94
27,651
344,775
8.43
29,057
6,113
3.05
186
1,920
4.73
91
1,402
5.07
71
$
1,098,139
5.19
%
$
56,993
526,812
6.69
%
$
35,219
445,440
7.93
%
$
35,341
$
70,179
0.14
%
$
100
5,650
1.12
%
$
64
5,057
3.16
%
$
160
351,892
0.39
1,375
166,691
1.32
2,195
147,939
2.78
4,105
140,197
1.24
1,738
39,481
3.08
1,215
40,484
4.38
1,773
20,459
2.03
415
6,656
2.83
187
8,937
4.87
435
53,166
0.27
146
47,578
1.81
860
36,761
4.57
1,679
635,893
0.59
3,774
266,056
1.70
4,521
239,178
3.41
8,152
51,972
0.44
231
65,826
2.25
1,478
25,854
4.81
1,245
231,801
2.50
5,786
102,283
3.70
3,789
93,193
5.18
4,824
4,904
3.50
172
-
-
-
-
-
-
924,570
1.08
9,963
434,165
2.25
9,788
358,225
3.97
14,221
173,569
-
-
92,647
-
-
87,215
-
-
$
1,098,139
0.91
9,963
526,812
1.86
9,788
445,440
3.19
14,221
4.28
%
$
47,030
4.83
%
$
25,431
4.74
%
$
21,120
$
19,218
11,175
11,806
23,997
13,353
11,957
121,000
53,056
51,549
$
164,215
77,584
75,312
$
171,712
87,820
88,907
48,193
28,658
26,287
117,879
53,753
47,333
(173,569)
(92,647)
(87,215)
$
164,215
77,584
75,312
$
1,262,354
604,396
520,752
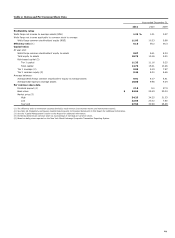
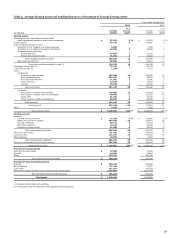
(5) Nonaccrual loans and related income are included in their respective loan categories.
(6) Includes taxable-equivalent adjustments of $696 million, $629 million, $706 million, $288 million and $146 million for 2011, 2010, 2009, 2008 and 2007, respectively,
primarily related to tax-exempt income on certain loans and securities. The federal statutory tax rate utilized was 35% for the periods presented.
35