Wells Fargo 2011 Annual Report Download - page 42
Download and view the complete annual report
Please find page 42 of the 2011 Wells Fargo annual report below. You can navigate through the pages in the report by either clicking on the pages listed below, or by using the keyword search tool below to find specific information within the annual report.-
 1
1 -
2
-
3
-
4
-
5
-
6
-
7
-
8
-
9
-
10
-
11
-
12
-
13
-
14
-
15
-
16
-
17
-
18
-
19
-
20
-
21
-
22
-
23
-
24
-
25
-
26
-
27
-
28
-
29
-
30
-
31
-
 32
32 -
 33
33 -
 34
34 -
 35
35 -
 36
36 -
 37
37 -
 38
38 -
 39
39 -
 40
40 -
 41
41 -
 42
42 -
 43
43 -
 44
44 -
 45
45 -
 46
46 -
 47
47 -
 48
48 -
 49
49 -
 50
50 -
 51
51 -
 52
52 -
53
-
54
-
55
-
56
-
57
-
58
-
59
-
60
-
61
-
62
-
63
-
64
-
65
-
66
-
67
-
68
-
69
-
70
-
71
-
72
-
73
-
74
-
75
-
76
-
77
-
78
-
79
-
80
-
81
-
82
-
83
-
84
-
85
-
86
-
87
-
88
-
89
-
90
-
91
-
92
-
93
-
94
-
95
-
96
-
97
-
98
-
99
-
100
-
101
-
102
-
103
-
104
-
105
-
106
-
107
-
108
-
109
-
110
-
111
-
112
-
113
-
114
-
115
-
116
-
117
-
118
-
119
-
120
-
121
-
122
-
123
-
124
-
125
-
126
-
127
-
128
-
129
-
130
-
131
-
132
-
133
-
134
-
135
-
136
-
137
-
138
-
139
-
140
-
141
-
142
-
143
-
144
-
145
-
146
-
147
-
148
-
149
-
150
-
151
-
152
-
153
-
154
-
155
-
156
-
157
-
158
-
159
-
160
-
161
-
162
-
163
-
164
-
165
-
166
-
167
-
168
-
169
-
170
-
171
-
172
-
173
-
174
-
175
-
176
-
177
-
178
-
179
-
180
-
181
-
182
-
183
-
184
-
185
-
186
-
187
-
188
-
189
-
190
-
191
-
192
-
193
-
194
-
195
-
196
-
197
-
198
-
199
-
200
-
201
-
202
-
203
-
204
-
205
-
206
-
207
-
208
-
209
-
210
-
211
-
212
-
213
-
214
-
215
-
216
-
217
-
218
-
219
-
220
-
221
-
222
-
223
-
224
-
225
-
226
-
227
-
228
-
229
-
230
-
231
-
232
-
233
-
234
-
235
-
236
-
237
-
238
-
239
-
240
 |
 |

Earnings Performance (continued)
Operating Segment Results
We are organized for management reporting purposes into three
operating segments: Community Banking; Wholesale Banking;
and Wealth, Brokerage and Retirement. These segments are
defined by product type and customer segment and their results
are based on our management accounting process, for which
there is no comprehensive, authoritative financial accounting
guidance equivalent to generally accepted accounting principles
(GAAP). In fourth quarter 2010, we aligned certain lending
businesses into Wholesale Banking from Community Banking to
reflect our previously announced restructuring of Wells Fargo
Financial.
In first quarter 2011, we realigned a private equity
business into Wholesale Banking from Community Banking.
Prior
periods have been revised to reflect these changes. Table 9
and the following discussion present our results by operating
segment. For a more complete description of our operating
segments, including additional financial information and the
underlying management accounting process, see Note 24
(Operating Segments) to Financial Statements in this Report.
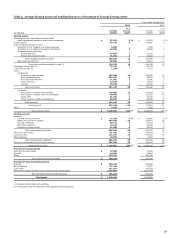
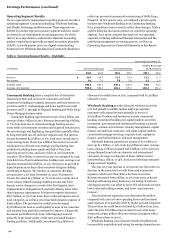
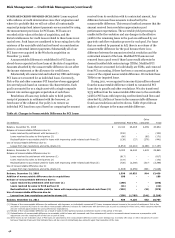
Table 9: Operating Segment Results – Highlights
Year ended December 31,
Wealth, Brokerage
(in billions)
Community Banking
Wholesale Banking
and Retirement
2011
2010
2011
2010
2011
2010
Revenue
$
50.7
54.5
21.7
22.4
12.2
11.7
Net income
9.1
7.0
7.0
5.9
1.3
1.0
Average loans
498.1
530.1
249.1
230.5
43.0
43.0
Average core deposits
556.2
536.4
202.1
170.0
130.4
121.2
Community Banking offers a complete line of diversified
financial products and services for consumers and small
businesses including investment, insurance and trust services in
39 states and D.C., and mortgage and home equity loans in all
50 states and D.C. through its Regional Banking and Wells Fargo
Home Mortgage business units.
Community Banking reported net income of $9.1 billion and
revenue of $50.7 billion in 2011. Revenue decreased $3.8 billion,
or 7%, from 2010 due to reduced mortgage banking income,
lower yields on investment securities and expected reductions in
the non-strategic and liquidating loan portfolios, partially offset
by long-term debt run-off and lower deposit costs. Net interest
income decreased $2.3 billion, or 7%, from 2010, mostly due to
lower average loans (down $32.0 billion from 2010) as a result
of planned run-off in the non-strategic and liquidating loan
portfolios (including home equity and Pick-A-Pay), loan
repricing at lower rates, and lower yields on our investment
securities. This decline in interest income was mitigated by long-
term debt run-off and continued low funding costs. Average core
deposits increased $19.8 billion, or 4%, from 2010, as growth in
liquid deposits more than offset maturities of higher yielding
certificates of deposit. The number of consumer checking
accounts grew 3.2% from December 31, 2010. Noninterest
income decreased $1.5 billion, or 7%, from 2010, mainly due to
lower volume-related mortgage banking income and lower
deposit service charges as a result of the third quarter 2010
implementation of Regulation E, partially offset by lower other
than temporary impairments. Noninterest expense decreased
$837 million, or 3%, from 2010, due to reduced expenses across
most categories, as well as a 2010 charitable donation expense of
$400 million. The provision for credit losses decreased
$5.8 billion from 2010 as credit quality in most of our consumer
and business loan portfolios continued to improve. Charge-offs
decreased $4.8 billion from 2010, reflecting improvement
primarily in the home equity, credit card, and small business
lending portfolios. Additionally, we released $2.4 billion of
allowance for credit losses in 2011, compared with $1.4 billion
released in 2010.
Wholesale Banking provides financial solutions across the
U.S. and globally to middle market and large corporate
customers with annual revenue generally in excess of
$20 million. Products and businesses include commercial
banking, investment banking and capital markets, securities
investment, government and institutional banking, corporate
banking, commercial real estate, treasury management, capital
finance, international, insurance, real estate capital markets,
commercial mortgage servicing, corporate trust, equipment
finance, asset backed finance, and asset management.
Wholesale Banking reported net income of $7.0 billion in
2011, up $1.1 billion, or 19%, from $5.9 billion in 2010. Average
loans of $249.1 billion increased $18.6 billion, or 8%, driven by
strong demand from both our domestic and international
customers. Average core deposits of $202.1 billion in 2011
increased $32.1 billion, or 19%, from 2010 reflecting continued
strong customer liquidity.
The year over year increase in net income was the result of a
decrease in the provision for credit losses and noninterest
expenses, which more than offset a decrease in revenue.
Revenue decreased $759 million, or 3%, from 2010, as broad-
based growth among many businesses, including strong loan
and deposit growth, was offset by lower PCI resolutions revenue,
lower sales and trading revenue, and lower crop insurance
revenue.
Total noninterest expense in 2011 decreased $75 million
compared with 2010 as lower operating losses and foreclosed
asset expenses were partially offset by higher personnel expense.
The provision for credit losses declined $2.0 billion from 2010,
and reflected a $1.6 billion improvement in net credit losses
along with a $950 million allowance release (compared with a
$561 million release in 2010).
Wholesale Banking’s 2011 financial results benefited from
loan portfolio acquisitions and strong borrowing demand across
40