Wells Fargo 2011 Annual Report Download - page 38
Download and view the complete annual report
Please find page 38 of the 2011 Wells Fargo annual report below. You can navigate through the pages in the report by either clicking on the pages listed below, or by using the keyword search tool below to find specific information within the annual report.-
 1
1 -
2
-
3
-
4
-
5
-
6
-
7
-
8
-
9
-
10
-
11
-
12
-
13
-
14
-
15
-
16
-
17
-
18
-
19
-
20
-
21
-
22
-
23
-
24
-
25
-
26
-
27
-
 28
28 -
 29
29 -
 30
30 -
 31
31 -
 32
32 -
 33
33 -
 34
34 -
 35
35 -
 36
36 -
 37
37 -
 38
38 -
 39
39 -
 40
40 -
 41
41 -
 42
42 -
 43
43 -
 44
44 -
 45
45 -
 46
46 -
 47
47 -
 48
48 -
49
-
50
-
51
-
52
-
53
-
54
-
55
-
56
-
57
-
58
-
59
-
60
-
61
-
62
-
63
-
64
-
65
-
66
-
67
-
68
-
69
-
70
-
71
-
72
-
73
-
74
-
75
-
76
-
77
-
78
-
79
-
80
-
81
-
82
-
83
-
84
-
85
-
86
-
87
-
88
-
89
-
90
-
91
-
92
-
93
-
94
-
95
-
96
-
97
-
98
-
99
-
100
-
101
-
102
-
103
-
104
-
105
-
106
-
107
-
108
-
109
-
110
-
111
-
112
-
113
-
114
-
115
-
116
-
117
-
118
-
119
-
120
-
121
-
122
-
123
-
124
-
125
-
126
-
127
-
128
-
129
-
130
-
131
-
132
-
133
-
134
-
135
-
136
-
137
-
138
-
139
-
140
-
141
-
142
-
143
-
144
-
145
-
146
-
147
-
148
-
149
-
150
-
151
-
152
-
153
-
154
-
155
-
156
-
157
-
158
-
159
-
160
-
161
-
162
-
163
-
164
-
165
-
166
-
167
-
168
-
169
-
170
-
171
-
172
-
173
-
174
-
175
-
176
-
177
-
178
-
179
-
180
-
181
-
182
-
183
-
184
-
185
-
186
-
187
-
188
-
189
-
190
-
191
-
192
-
193
-
194
-
195
-
196
-
197
-
198
-
199
-
200
-
201
-
202
-
203
-
204
-
205
-
206
-
207
-
208
-
209
-
210
-
211
-
212
-
213
-
214
-
215
-
216
-
217
-
218
-
219
-
220
-
221
-
222
-
223
-
224
-
225
-
226
-
227
-
228
-
229
-
230
-
231
-
232
-
233
-
234
-
235
-
236
-
237
-
238
-
239
-
240
 |
 |

Earnings Performance (continued)
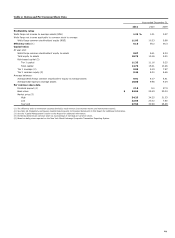
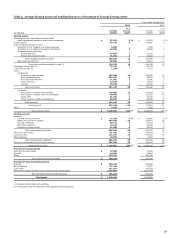
Table 6 allocates the changes in net interest income on a
taxable-equivalent basis to changes in either average balances or
average rates for both interest-earning assets and
interest-bearing liabilities. Because of the numerous
simultaneous volume and rate changes during any period, it is
not possible to precisely allocate such changes between volume
and rate. For this table, changes that are not solely due to either
volume or rate are allocated to these categories in proportion to
the percentage changes in average volume and average rate.
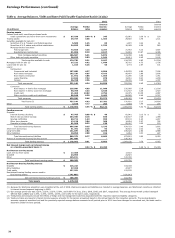
Table 6: Analysis of Changes in Net Interest Income
Year ended December 31,
2011 over 2010
2010 over 2009
(in millions)
Volume
Rate
Total
Volume
Rate
Total
Increase (decrease) in interest income:
Federal funds sold, securities purchased under resale
agreements and other short-term investments
$
89
26
115
148
(68)
80
Trading assets
363
(21)
342
349
(172)
177
Debt securities available for sale (1):
Securities of U.S. Treasury and federal agencies
62
(54)
8
(2)
(6)
(8)
Securities of U.S. states and political subdivisions
424
(181)
243
338
(198)
140
Mortgage-backed securities:
Federal agencies
135
(575)
(440)
(114)
(780)
(894)
Residential and commercial
9
(788)
(779)
(176)
(578)
(754)
Total mortgage-backed securities
144
(1,363)
(1,219)
(290)
(1,358)
(1,648)
Other debt securities
349
(510)
(161)
79
(268)
(189)
Total debt securities available for sale
979
(2,108)
(1,129)
125
(1,830)
(1,705)
Mortgages held for sale
24
(116)
(92)
(35)
(159)
(194)
Loans held for sale
(100)
57
(43)
(69)
(13)
(82)
Loans:
Commercial:
Commercial and industrial
373
(665)
(292)
(1,425)
968
(457)
Real estate mortgage
147
180
327
81
390
471
Real estate construction
(385)
389
4
(306)
167
(139)
Lease financing
(45)
(218)
(263)
(120)
(16)
(136)
Foreign
215
(311)
(96)
(36)
(139)
(175)
Total commercial
305
(625)
(320)
(1,806)
1,370
(436)
Consumer:
Real estate 1-4 family first mortgage
(440)
(676)
(1,116)
(150)
(636)
(786)
Real estate 1-4 family junior lien mortgage
(473)
(120)
(593)
(249)
(321)
(570)
Credit card
(120)
(73)
(193)
(123)
269
146
Other revolving credit and installment
(111)
(173)
(284)
(140)
(65)
(205)
Total consumer
(1,144)
(1,042)
(2,186)
(662)
(753)
(1,415)
Total loans
(839)
(1,667)
(2,506)
(2,468)
617
(1,851)
Other
(35)
31
(4)
(8)
29
21
Total increase (decrease) in interest income
481
(3,798)
(3,317)
(1,958)
(1,596)
(3,554)
Increase (decrease) in interest expense:
Deposits:
Interest-bearing checking
(13)
(19)
(32)
(13)
(15)
(28)
Market rate and other savings
112
(364)
(252)
224
(511)
(287)
Savings certificates
(252)
-
(252)
(729)
238
(491)
Other time deposits
(30)
(4)
(34)
(121)
8
(113)
Deposits in foreign offices
13
-
13
5
(28)
(23)
Total interest-bearing deposits
(170)
(387)
(557)
(634)
(308)
(942)
Short-term borrowings
9
(21)
(12)
(21)
(104)
(125)
Long-term debt
(1,227)
317
(910)
(1,209)
311
(898)
Other liabilities
122
(33)
89
65
(10)
55
Total increase (decrease) in interest expense
(1,266)
(124)
(1,390)
(1,799)
(111)
(1,910)
Increase (decrease) in net interest income
on a taxable-equivalent basis
$
1,747
(3,674)
(1,927)
(159)
(1,485)
(1,644)
(1)
Volume and rate amounts for 2010 over 2009 have been revised to reflect the use of amortized cost as the basis for calculating the change between periods.
36