Wells Fargo 2011 Annual Report Download - page 193
Download and view the complete annual report
Please find page 193 of the 2011 Wells Fargo annual report below. You can navigate through the pages in the report by either clicking on the pages listed below, or by using the keyword search tool below to find specific information within the annual report.-
 1
1 -
2
-
3
-
4
-
5
-
6
-
7
-
8
-
9
-
10
-
11
-
12
-
13
-
14
-
15
-
16
-
17
-
18
-
19
-
20
-
21
-
22
-
23
-
24
-
25
-
26
-
27
-
28
-
29
-
30
-
31
-
32
-
33
-
34
-
35
-
36
-
37
-
38
-
39
-
40
-
41
-
42
-
43
-
44
-
45
-
46
-
47
-
48
-
49
-
50
-
51
-
52
-
53
-
54
-
55
-
56
-
57
-
58
-
59
-
60
-
61
-
62
-
63
-
64
-
65
-
66
-
67
-
68
-
69
-
70
-
71
-
72
-
73
-
74
-
75
-
76
-
77
-
78
-
79
-
80
-
81
-
82
-
83
-
84
-
85
-
86
-
87
-
88
-
89
-
90
-
91
-
92
-
93
-
94
-
95
-
96
-
97
-
98
-
99
-
100
-
101
-
102
-
103
-
104
-
105
-
106
-
107
-
108
-
109
-
110
-
111
-
112
-
113
-
114
-
115
-
116
-
117
-
118
-
119
-
120
-
121
-
122
-
123
-
124
-
125
-
126
-
127
-
128
-
129
-
130
-
131
-
132
-
133
-
134
-
135
-
136
-
137
-
138
-
139
-
140
-
141
-
142
-
143
-
144
-
145
-
146
-
147
-
148
-
149
-
150
-
151
-
152
-
153
-
154
-
155
-
156
-
157
-
158
-
159
-
160
-
161
-
162
-
163
-
164
-
165
-
166
-
167
-
168
-
169
-
170
-
171
-
172
-
173
-
174
-
175
-
176
-
177
-
178
-
179
-
180
-
181
-
182
-
 183
183 -
 184
184 -
 185
185 -
 186
186 -
 187
187 -
 188
188 -
 189
189 -
 190
190 -
 191
191 -
 192
192 -
 193
193 -
 194
194 -
 195
195 -
 196
196 -
 197
197 -
 198
198 -
 199
199 -
 200
200 -
 201
201 -
 202
202 -
 203
203 -
204
-
205
-
206
-
207
-
208
-
209
-
210
-
211
-
212
-
213
-
214
-
215
-
216
-
217
-
218
-
219
-
220
-
221
-
222
-
223
-
224
-
225
-
226
-
227
-
228
-
229
-
230
-
231
-
232
-
233
-
234
-
235
-
236
-
237
-
238
-
239
-
240
 |
 |
include use of option pricing models, discounted cash flow
models and similar techniques.
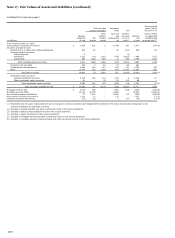
In the determination of the classification of financial
instruments in Level 2 or Level 3 of the fair value hierarchy, we
consider all available information, including observable market
data, indications of market liquidity and orderliness, and our
understanding of the valuation techniques and significant inputs
used. For securities in inactive markets, we use a predetermined
percentage to evaluate the impact of fair value adjustments
derived from weighting both external and internal indications of
value to determine if the instrument is classified as Level 2 or
Level 3. Based upon the specific facts and circumstances of each
instrument or instrument category, judgments are made
regarding the significance of the Level 3 inputs to the
instruments' fair value measurement in its entirety. If Level 3
inputs are considered significant, the instrument is classified as
Level 3.
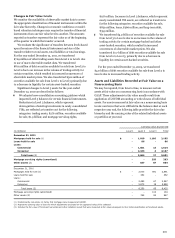
Determination of Fair Value
We base our fair values on the price that would be received to
sell an asset or paid to transfer a liability in an orderly
transaction between market participants at the measurement
date. We maximize the use of observable inputs and minimize
the use of unobservable inputs when developing fair value
measurements.
In instances where there is limited or no observable market
data, fair value measurements for assets and liabilities are based
primarily upon our own estimates or combination of our own
estimates and independent vendor or broker pricing, and the
measurements are often calculated based on current pricing for
products we offer or issue, the economic and competitive
environment, the characteristics of the asset or liability and
other such factors. As with any valuation technique used to
estimate fair value, changes in underlying assumptions used,
including discount rates and estimates of future cash flows,
could significantly affect the results of current or future values.
Accordingly, these fair value estimates may not be realized in an
actual sale or immediate settlement of the asset or liability.
We incorporate lack of liquidity into our fair value
measurement based on the type of asset or liability measured
and the valuation methodology used. For example, for certain
residential MHFS and certain securities where the significant
inputs have become unobservable due to illiquid markets and
vendor or broker pricing is not used, we use a discounted cash
flow technique to measure fair value. This technique
incorporates forecasting of expected cash flows (adjusted for
credit loss assumptions and estimated prepayment speeds)
discounted at an appropriate market discount rate to reflect the
lack of liquidity in the market that a market participant would
consider. For other securities where vendor or broker pricing is
used, we use either unadjusted broker quotes or vendor prices or
vendor or broker prices adjusted by weighting them with
internal discounted cash flow techniques to measure fair value.
These unadjusted vendor or broker prices inherently reflect any
lack of liquidity in the market, as the fair value measurement
represents an exit price from a market participant viewpoint.
Following are descriptions of the valuation methodologies
used for assets and liabilities recorded at fair value on a
recurring or nonrecurring basis and for estimating fair value for
financial instruments not recorded at fair value.
Assets
SHORT-TERM FINANCIAL ASSETS
Short-term financial assets
include cash and due from banks, federal funds sold and
securities purchased under resale agreements and due from
customers on acceptances. These assets are carried at historical
cost. The carrying amount is a reasonable estimate of fair value
because of the relatively short time between the origination of
the instrument and its expected realization.
TRADING ASSETS (EXCLUDING DERIVATIVES) AND
SECURITIES AVAILABLE FOR SALE
Trading assets and
securities available for sale are recorded at fair value on a
recurring basis. Fair value measurement is based upon quoted
prices in active markets, if available. Such instruments are
classified within Level 1 of the fair value hierarchy. Examples
include exchange-traded equity securities and some highly liquid
government securities such as U.S. Treasuries. When
instruments are traded in secondary markets and quoted market
prices do not exist for such securities, we generally rely on
internal valuation techniques or on prices obtained from
independent pricing services or brokers (collectively, vendors) or
combination thereof.
Trading securities are mostly valued using trader prices that
are subject to internal price verification procedures. The
majority of fair values derived using internal valuation
techniques are verified against multiple pricing sources,
including prices obtained from independent vendors. Vendors
compile prices from various sources and often apply matrix
pricing for similar securities when no price is observable. We
review pricing methodologies provided by the vendors in order
to determine if observable market information is being used,
versus unobservable inputs. When we evaluate the
appropriateness of an internal trader price compared with
vendor prices, our considerations include the range and quality
of vendor prices. Vendor prices are used to ensure the
reasonableness of a trader price; however valuing financial
instruments involves judgments acquired from knowledge of a
particular market and is not perfunctory. If a trader asserts that
a vendor price is not reflective of market value, justification for
using the trader price, including recent sales activity where
possible, must be provided to and approved by the appropriate
levels of management.
Similarly, while securities available for sale traded in
secondary markets are typically valued using unadjusted vendor
prices or vendor prices adjusted by weighting them with internal
discounted cash flow techniques, these prices are reviewed and,
if deemed inappropriate by a trader who has the most knowledge
of a particular market, can be adjusted. Securities measured with
these internal valuation techniques are generally classified as
Level 2 of the hierarchy and often involve using quoted market
prices for similar securities, pricing models, discounted cash
flow analyses using significant inputs observable in the market
where available or combination of multiple valuation techniques.
Examples include certain residential and commercial MBS,
191