Wells Fargo 2011 Annual Report Download - page 29
Download and view the complete annual report
Please find page 29 of the 2011 Wells Fargo annual report below. You can navigate through the pages in the report by either clicking on the pages listed below, or by using the keyword search tool below to find specific information within the annual report.-
 1
1 -
2
-
3
-
4
-
5
-
6
-
7
-
8
-
9
-
10
-
11
-
12
-
13
-
14
-
15
-
16
-
17
-
18
-
 19
19 -
 20
20 -
 21
21 -
 22
22 -
 23
23 -
 24
24 -
 25
25 -
 26
26 -
 27
27 -
 28
28 -
 29
29 -
 30
30 -
 31
31 -
 32
32 -
 33
33 -
 34
34 -
 35
35 -
 36
36 -
 37
37 -
 38
38 -
 39
39 -
40
-
41
-
42
-
43
-
44
-
45
-
46
-
47
-
48
-
49
-
50
-
51
-
52
-
53
-
54
-
55
-
56
-
57
-
58
-
59
-
60
-
61
-
62
-
63
-
64
-
65
-
66
-
67
-
68
-
69
-
70
-
71
-
72
-
73
-
74
-
75
-
76
-
77
-
78
-
79
-
80
-
81
-
82
-
83
-
84
-
85
-
86
-
87
-
88
-
89
-
90
-
91
-
92
-
93
-
94
-
95
-
96
-
97
-
98
-
99
-
100
-
101
-
102
-
103
-
104
-
105
-
106
-
107
-
108
-
109
-
110
-
111
-
112
-
113
-
114
-
115
-
116
-
117
-
118
-
119
-
120
-
121
-
122
-
123
-
124
-
125
-
126
-
127
-
128
-
129
-
130
-
131
-
132
-
133
-
134
-
135
-
136
-
137
-
138
-
139
-
140
-
141
-
142
-
143
-
144
-
145
-
146
-
147
-
148
-
149
-
150
-
151
-
152
-
153
-
154
-
155
-
156
-
157
-
158
-
159
-
160
-
161
-
162
-
163
-
164
-
165
-
166
-
167
-
168
-
169
-
170
-
171
-
172
-
173
-
174
-
175
-
176
-
177
-
178
-
179
-
180
-
181
-
182
-
183
-
184
-
185
-
186
-
187
-
188
-
189
-
190
-
191
-
192
-
193
-
194
-
195
-
196
-
197
-
198
-
199
-
200
-
201
-
202
-
203
-
204
-
205
-
206
-
207
-
208
-
209
-
210
-
211
-
212
-
213
-
214
-
215
-
216
-
217
-
218
-
219
-
220
-
221
-
222
-
223
-
224
-
225
-
226
-
227
-
228
-
229
-
230
-
231
-
232
-
233
-
234
-
235
-
236
-
237
-
238
-
239
-
240
 |
 |
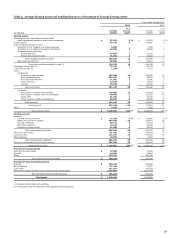
servicing rights (MSRs) valuation and increased our estimate of
losses for repurchases of serviced loans.
Wells Fargo net income was $15.9 billion and diluted
earnings per common share were $2.82 for 2011, both up 28%
from 2010. Our net income growth from 2010 was primarily
driven by a lower provision for credit losses and lower
noninterest expense, which more than offset lower revenues. Net
income growth from 2010 included contributions from each of
our three business segments: Community Banking (up 30%);
Wholesale Banking (up 19%); and Wealth, Brokerage and
Retirement (up 28%). Return on average assets was 1.25% for
2011, compared with 1.01% for 2010. Our return on equity was
11.93% in 2011, up from 10.33% in 2010.
On a year-over-year basis, revenue was down 5% in 2011,
predominantly reflecting decreased interest income on securities
available for sale and loans due to lower yields as market rates
declined. The decline in revenue was also affected by lower
mortgage banking noninterest income as a result of lower
originations and higher servicing-related costs caused by the
regulatory consent orders and other mortgage-related regulatory
matters as well as lower net gains from trading activities. These
decreases in revenue were partially offset by increased interest
income on trading assets and decreased interest expense.
Noninterest expense was down 2% from 2010 reflecting the
benefit of reduced merger integration costs and lower foreclosed
asset expense.
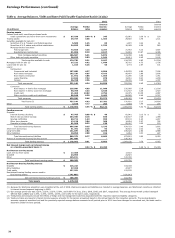
We believe loan and deposit growth have positioned us for
continued improvement in financial performance. Total loans
were $769.6 billion at December 31, 2011, up from $757.3 billion
at December 31, 2010, and averaged $757.1 billion for 2011
compared with $770.6 billion for 2010. The net growth in loans
from December 31, 2010, included the consolidation of
$5.6 billion of reverse mortgage loans previously sold as well as
the purchases with a period end balance of $3.6 billion of U.S.-
based commercial real estate (CRE), offset by a $21.0 billion
decrease in our non-strategic and liquidating loan portfolios.
Our core deposits totaled $872.6 billion at December 31, 2011,
up 9% from December 31, 2010, and our average core deposits
grew 7% from 2010 to $826.7 billion for 2011. Average core
deposits were 109% of average loans for 2011, up from 100% for
2010. We continued to attract high quality core deposits in the
form of checking and savings deposits, which on average totaled
$757.0 billion, up 11% from 2010 as we added new customers
and deepened our relationships with existing customers. Average
core checking and savings deposits were 92% of average core
deposits, up from 89% for 2010.
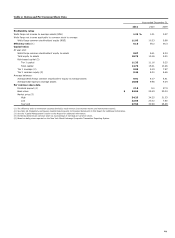
Table 1 provides a six-year summary of selected financial
data and Table 2 presents key ratios and per common share data.
Credit Quality
As in 2010, we again experienced credit improvement during
2011 in our loan portfolios with lower net charge-offs and
improved or stable delinquency trends. The rate of improvement
moderated in some portfolios during the latter half of 2011,
consistent with our expectations at this point in the credit cycle.
The improvement in our credit portfolio was due in part to the
continued decline in balances in our non-strategic and
liquidating loan portfolios (primarily from the Wachovia
acquisition), which decreased $21.0 billion during 2011, and
$78.5 billion in total since the beginning of 2009, to
$112.3 billion at December 31, 2011.
Reflecting the continued improved credit performance in our
loan portfolios, the $7.9 billion provision for credit losses for
2011 was $7.9 billion less than a year ago. The 2011 provision for
credit losses was $3.4 billion less than net charge-offs, compared
with $2.0 billion less for 2010. Absent significant deterioration
in the economy, we expect future allowance releases in 2012,
although at more modest levels. Since first quarter 2010 net
charge-offs have decreased every quarter until fourth quarter
2011 when they were essentially flat compared with third quarter
2011. Nonperforming assets (NPAs) have decreased every
quarter since their peak in third quarter 2010. Net charge-offs
totaled $11.3 billion for 2011, compared with $17.8 billion for
2010. NPAs decreased to $26.0 billion at December 31, 2011,
from $32.3 billion at December 31, 2010. Loans 90 days or more
past due and still accruing (excluding government
insured/guaranteed loans) decreased to $2.0 billion at
December 31, 2011, from $2.6 billion at December 31, 2010. In
addition, our portfolio of purchased credit-impaired (PCI) loans
continued to perform better than expected at the time of
acquisition.
Capital
We continued to build capital in 2011, with total equity up
$13.8 billion to $141.7 billion from December 31, 2010. Our Tier
1 common equity ratio grew 116 basis points during 2011 to
9.46% of risk-weighted assets under Basel I, reflecting strong
internal capital generation. Based on our interpretation of
current Basel III capital proposals, we estimate that our Tier 1
common equity ratio was 7.50% at the end of 2011. Our other
regulatory capital ratios remained strong with a Tier 1 capital
ratio of 11.33% and Tier 1 leverage ratio of 9.03% at
December 31, 2011. See the “Capital Management” section in this
Report for more information regarding our capital, including
Tier 1 common equity.
During 2011 we redeemed $9.2 billion of trust preferred
securities that carried a higher cost than other funding sources
available to us, repurchased approximately 80 million shares of
our common stock and entered into two separate $150 million
private forward repurchase transactions. The first transaction
settled in fourth quarter 2011 for approximately 6 million shares
of common stock and the second transaction settled in first
quarter 2012 for approximately 6 million shares of common
stock. We also paid common stock dividends of $0.12 per share
each quarter in 2011.
27