Wells Fargo 2011 Annual Report Download - page 39
Download and view the complete annual report
Please find page 39 of the 2011 Wells Fargo annual report below. You can navigate through the pages in the report by either clicking on the pages listed below, or by using the keyword search tool below to find specific information within the annual report.-
 1
1 -
2
-
3
-
4
-
5
-
6
-
7
-
8
-
9
-
10
-
11
-
12
-
13
-
14
-
15
-
16
-
17
-
18
-
19
-
20
-
21
-
22
-
23
-
24
-
25
-
26
-
27
-
28
-
 29
29 -
 30
30 -
 31
31 -
 32
32 -
 33
33 -
 34
34 -
 35
35 -
 36
36 -
 37
37 -
 38
38 -
 39
39 -
 40
40 -
 41
41 -
 42
42 -
 43
43 -
 44
44 -
 45
45 -
 46
46 -
 47
47 -
 48
48 -
 49
49 -
50
-
51
-
52
-
53
-
54
-
55
-
56
-
57
-
58
-
59
-
60
-
61
-
62
-
63
-
64
-
65
-
66
-
67
-
68
-
69
-
70
-
71
-
72
-
73
-
74
-
75
-
76
-
77
-
78
-
79
-
80
-
81
-
82
-
83
-
84
-
85
-
86
-
87
-
88
-
89
-
90
-
91
-
92
-
93
-
94
-
95
-
96
-
97
-
98
-
99
-
100
-
101
-
102
-
103
-
104
-
105
-
106
-
107
-
108
-
109
-
110
-
111
-
112
-
113
-
114
-
115
-
116
-
117
-
118
-
119
-
120
-
121
-
122
-
123
-
124
-
125
-
126
-
127
-
128
-
129
-
130
-
131
-
132
-
133
-
134
-
135
-
136
-
137
-
138
-
139
-
140
-
141
-
142
-
143
-
144
-
145
-
146
-
147
-
148
-
149
-
150
-
151
-
152
-
153
-
154
-
155
-
156
-
157
-
158
-
159
-
160
-
161
-
162
-
163
-
164
-
165
-
166
-
167
-
168
-
169
-
170
-
171
-
172
-
173
-
174
-
175
-
176
-
177
-
178
-
179
-
180
-
181
-
182
-
183
-
184
-
185
-
186
-
187
-
188
-
189
-
190
-
191
-
192
-
193
-
194
-
195
-
196
-
197
-
198
-
199
-
200
-
201
-
202
-
203
-
204
-
205
-
206
-
207
-
208
-
209
-
210
-
211
-
212
-
213
-
214
-
215
-
216
-
217
-
218
-
219
-
220
-
221
-
222
-
223
-
224
-
225
-
226
-
227
-
228
-
229
-
230
-
231
-
232
-
233
-
234
-
235
-
236
-
237
-
238
-
239
-
240
 |
 |

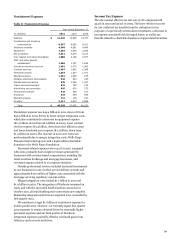
Noninterest Income
Table 7: Noninterest Income
Year ended December 31,
(in millions)
2011
2010
2009
Service charges on
deposit accounts
$
4,280
4,916
5,741
Trust and investment fees:
Trust, investment and IRA fees
4,099
4,038
3,588
Commissions and all other fees
7,205
6,896
6,147
Total trust and
investment fees
11,304
10,934
9,735
Card fees
3,653
3,652
3,683
Other fees:
Cash network fees
389
260
231
Charges and fees on loans
1,641
1,690
1,801
Processing and all other fees
2,163
2,040
1,772
Total other fees
4,193
3,990
3,804
Mortgage banking:
Servicing income, net
3,266
3,340
5,791
Net gains on mortgage loan
origination/sales activities
4,566
6,397
6,237
Total mortgage banking
7,832
9,737
12,028
Insurance
1,960
2,126
2,126
Net gains from trading activities
1,014
1,648
2,674
Net gains (losses) on debt
securities available for sale
54
(324)
(127)
Net gains from equity investments
1,482
779
185
Operating leases
524
815
685
All other
1,889
2,180
1,828
Total
$
38,185
40,453
42,362
Noninterest income of $38.2 billion represented 47% of revenue
for 2011 compared with $40.5 billion, or 47%, for 2010. The
decrease in noninterest income from 2010 was due largely to
lower service charges on deposit accounts, lower net gains on
mortgage loan origination/sales activities and lower net gains
from trading activities.
Our service charges on deposit accounts decreased in 2011 by
$636 million, or 13% from 2010, predominantly due to changes
implemented in third quarter 2010 mandated by Regulation E
(which limited certain overdraft fees) and related overdraft
policy changes.
We earn trust, investment and IRA (Individual Retirement
Account) fees from managing and administering assets,
including mutual funds, corporate trust, personal trust,
employee benefit trust and agency assets. At December 31, 2011,
these assets totaled $2.2 trillion, up 5% from $2.1 trillion at
December 31, 2010. Trust, investment and IRA fees are largely
based on a tiered scale relative to the market value of the assets
under management or administration. These fees increased to
$4.1 billion in 2011 from $4.0 billion in 2010.
We receive commissions and other fees for providing services
to full-service and discount brokerage customers as well as from
investment banking activities including equity and bond
underwriting. These fees increased to $7.2 billion in 2011 from
$6.9 billion in 2010. Our commission and other fees include
transactional commissions, which are based on the number of
transactions executed at the customer’s direction, and
asset-based fees, which are based on the market value of the
customer’s assets. Brokerage client assets totaled $1.1 trillion
and $1.2 trillion at December 31, 2011 and 2010, respectively.
Card fees were $3.7 billion in 2011, essentially flat from 2010.
Legislative and regulatory changes enacted in 2010 led to a
reduction in card fee income, which was offset by growth in
purchase volume and new accounts growth. The final Federal
Reserve Board (FRB) rules implementing the Durbin
Amendment to the Dodd-Frank Act became effective in October
2011, placing limits on debit card interchange fees. As a result,
debit card interchange fees were reduced by $365 million during
fourth quarter 2011 as compared to fees that would have been
earned without the limits. We currently expect future volume,
product or account changes may over time mitigate at least half
of the earnings reduction resulting from the FRB’s debit card
interchange rules.
Mortgage banking noninterest income, consisting of net
servicing income and net gains on loan origination/sales
activities, totaled $7.8 billion in 2011, compared with $9.7 billion
in 2010. The reduction in mortgage banking noninterest income
was primarily driven by a decline in net gains on mortgage loan
origination/sales activities as discussed below.
Net mortgage loan servicing income includes both changes in
the fair value of MSRs during the period as well as changes in the
value of derivatives (economic hedges) used to hedge the MSRs.
Net servicing income for 2011 included a $1.6 billion net MSR
valuation gain ($3.7 billion decrease in the fair value of the
MSRs offset by a $5.3 billion hedge gain) and for 2010 included
a $1.5 billion net MSR valuation gain ($3.0 billion decrease in
the fair value of MSRs offset by a $4.5 billion hedge gain). See
the “Risk Management – Mortgage Banking Interest Rate and
Market Risk” section of this Report for additional information
regarding our MSRs risks and hedging approach. The valuation
of our MSRs at the end of 2011 reflected our assessment of
expected future levels in servicing and foreclosure costs. See the
“Risk Management – Credit Risk Management – Risks Relating
to Servicing Activities” section in this Report for information on
the regulatory consent orders. Our portfolio of loans serviced for
others was $1.85 trillion at December 31, 2011, and $1.84 trillion
at December 31, 2010. At December 31, 2011, the ratio of MSRs
to related loans serviced for others was 0.76%, compared with
0.86% at December 31, 2010.
Income from loan origination/sale activities was $4.6 billion
in 2011 compared with $6.4 billion in 2010. The decrease in 2011
was driven by lower loan origination volume and margins on
loan originations, partially offset by lower provision for
mortgage loan repurchase losses. Residential real estate
originations were $357 billion in 2011, compared with
$386 billion a year ago, and mortgage applications were
$537 billion in 2011, compared with $620 billion in 2010. The
1-4 family first mortgage unclosed pipeline was $72 billion at
December 31, 2011, and $73 billion at December 31, 2010. For
additional information, see the “Risk Management – Mortgage
Banking Interest Rate and Market Risk” section and Note 1
(Summary of Significant Accounting Policies), Note 9 (Mortgage
Banking Activities) and Note 17 (Fair Values of Assets and
Liabilities) to Financial Statements in this Report.
37