Wells Fargo 2011 Annual Report Download - page 177
Download and view the complete annual report
Please find page 177 of the 2011 Wells Fargo annual report below. You can navigate through the pages in the report by either clicking on the pages listed below, or by using the keyword search tool below to find specific information within the annual report.-
 1
1 -
2
-
3
-
4
-
5
-
6
-
7
-
8
-
9
-
10
-
11
-
12
-
13
-
14
-
15
-
16
-
17
-
18
-
19
-
20
-
21
-
22
-
23
-
24
-
25
-
26
-
27
-
28
-
29
-
30
-
31
-
32
-
33
-
34
-
35
-
36
-
37
-
38
-
39
-
40
-
41
-
42
-
43
-
44
-
45
-
46
-
47
-
48
-
49
-
50
-
51
-
52
-
53
-
54
-
55
-
56
-
57
-
58
-
59
-
60
-
61
-
62
-
63
-
64
-
65
-
66
-
67
-
68
-
69
-
70
-
71
-
72
-
73
-
74
-
75
-
76
-
77
-
78
-
79
-
80
-
81
-
82
-
83
-
84
-
85
-
86
-
87
-
88
-
89
-
90
-
91
-
92
-
93
-
94
-
95
-
96
-
97
-
98
-
99
-
100
-
101
-
102
-
103
-
104
-
105
-
106
-
107
-
108
-
109
-
110
-
111
-
112
-
113
-
114
-
115
-
116
-
117
-
118
-
119
-
120
-
121
-
122
-
123
-
124
-
125
-
126
-
127
-
128
-
129
-
130
-
131
-
132
-
133
-
134
-
135
-
136
-
137
-
138
-
139
-
140
-
141
-
142
-
143
-
144
-
145
-
146
-
147
-
148
-
149
-
150
-
151
-
152
-
153
-
154
-
155
-
156
-
157
-
158
-
159
-
160
-
161
-
162
-
163
-
164
-
165
-
166
-
 167
167 -
 168
168 -
 169
169 -
 170
170 -
 171
171 -
 172
172 -
 173
173 -
 174
174 -
 175
175 -
 176
176 -
 177
177 -
 178
178 -
 179
179 -
 180
180 -
 181
181 -
 182
182 -
 183
183 -
 184
184 -
 185
185 -
 186
186 -
 187
187 -
188
-
189
-
190
-
191
-
192
-
193
-
194
-
195
-
196
-
197
-
198
-
199
-
200
-
201
-
202
-
203
-
204
-
205
-
206
-
207
-
208
-
209
-
210
-
211
-
212
-
213
-
214
-
215
-
216
-
217
-
218
-
219
-
220
-
221
-
222
-
223
-
224
-
225
-
226
-
227
-
228
-
229
-
230
-
231
-
232
-
233
-
234
-
235
-
236
-
237
-
238
-
239
-
240
 |
 |

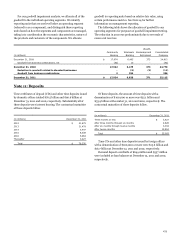
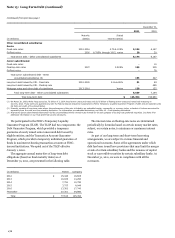
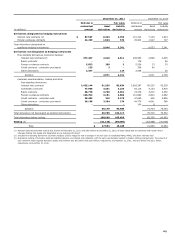
For our goodwill impairment analysis, we allocate all of the
goodwill to the individual operating segments. We identify
reporting units that are one level below an operating segment
(referred to as a component), and distinguish these reporting
units based on how the segments and components are managed,
taking into consideration the economic characteristics, nature of
the products and customers of the components. We allocate
goodwill to reporting units based on relative fair value, using
certain performance metrics. See Note 24 for further
information on management reporting.
The following table shows the allocation of goodwill to our
operating segments for purposes of goodwill impairment testing.
The reduction in 2010 was predominately due to reversals of
excess exit reserves.
Wealth,
Community
Wholesale
Brokerage and
Consolidated
(in millions)
Banking
Banking
Retirement
Company
December 31, 2009
$
17,974
6,465
373
24,812
Goodwill from business combinations, net
(52)
10
-
(42)
December 31, 2010
17,922
6,475
373
24,770
Reduction in goodwill related to divested businesses
-
(9)
(2)
(11)
Goodwill from business combinations
2
354
-
356
December 31, 2011
$
17,924
6,820
371
25,115
Note 11: Deposits
Time certificates of deposit (CDs) and other time deposits issued
by domestic offices totaled $76.5 billion and $90.6 billion at
December 31, 2011 and 2010, respectively. Substantially all of
these deposits were interest bearing. The contractual maturities
of these deposits follow.
(in millions)
December 31, 2011
2012
$
31,675
2013
21,479
2014
5,447
2015
8,538
2016
5,964
Thereafter
3,427
Total
$
76,530
Of these deposits, the amount of time deposits with a
denomination of $100,000 or more was $25.1 billion and
$33.9 billion at December 31, 2011 and 2010, respectively. The
contractual maturities of these deposits follow.
(in millions)
December 31, 2011
Three months or less
$
3,427
After three months through six months
2,828
After six months through twelve months
3,034
After twelve months
15,804
Total
$
25,093
Time CDs and other time deposits issued by foreign offices
with a denomination of $100,000 or more were $13.6 billion and
$16.7 billion at December 31, 2011 and 2010, respectively.
Demand deposit overdrafts of $649 million and $557 million
were included as loan balances at December 31, 2011 and 2010,
respectively.
175