Wells Fargo 2011 Annual Report Download - page 88
Download and view the complete annual report
Please find page 88 of the 2011 Wells Fargo annual report below. You can navigate through the pages in the report by either clicking on the pages listed below, or by using the keyword search tool below to find specific information within the annual report.-
 1
1 -
2
-
3
-
4
-
5
-
6
-
7
-
8
-
9
-
10
-
11
-
12
-
13
-
14
-
15
-
16
-
17
-
18
-
19
-
20
-
21
-
22
-
23
-
24
-
25
-
26
-
27
-
28
-
29
-
30
-
31
-
32
-
33
-
34
-
35
-
36
-
37
-
38
-
39
-
40
-
41
-
42
-
43
-
44
-
45
-
46
-
47
-
48
-
49
-
50
-
51
-
52
-
53
-
54
-
55
-
56
-
57
-
58
-
59
-
60
-
61
-
62
-
63
-
64
-
65
-
66
-
67
-
68
-
69
-
70
-
71
-
72
-
73
-
74
-
75
-
76
-
77
-
 78
78 -
 79
79 -
 80
80 -
 81
81 -
 82
82 -
 83
83 -
 84
84 -
 85
85 -
 86
86 -
 87
87 -
 88
88 -
 89
89 -
 90
90 -
 91
91 -
 92
92 -
 93
93 -
 94
94 -
 95
95 -
 96
96 -
 97
97 -
 98
98 -
99
-
100
-
101
-
102
-
103
-
104
-
105
-
106
-
107
-
108
-
109
-
110
-
111
-
112
-
113
-
114
-
115
-
116
-
117
-
118
-
119
-
120
-
121
-
122
-
123
-
124
-
125
-
126
-
127
-
128
-
129
-
130
-
131
-
132
-
133
-
134
-
135
-
136
-
137
-
138
-
139
-
140
-
141
-
142
-
143
-
144
-
145
-
146
-
147
-
148
-
149
-
150
-
151
-
152
-
153
-
154
-
155
-
156
-
157
-
158
-
159
-
160
-
161
-
162
-
163
-
164
-
165
-
166
-
167
-
168
-
169
-
170
-
171
-
172
-
173
-
174
-
175
-
176
-
177
-
178
-
179
-
180
-
181
-
182
-
183
-
184
-
185
-
186
-
187
-
188
-
189
-
190
-
191
-
192
-
193
-
194
-
195
-
196
-
197
-
198
-
199
-
200
-
201
-
202
-
203
-
204
-
205
-
206
-
207
-
208
-
209
-
210
-
211
-
212
-
213
-
214
-
215
-
216
-
217
-
218
-
219
-
220
-
221
-
222
-
223
-
224
-
225
-
226
-
227
-
228
-
229
-
230
-
231
-
232
-
233
-
234
-
235
-
236
-
237
-
238
-
239
-
240
 |
 |
Capital Management (continued)
$7.70 per warrant. We have purchased an additional
916,216 warrants since the U.S. Treasury auction. At
December 31, 2011, there were 39,179,509 warrants outstanding
and exercisable and $453 million of unused warrant repurchase
authority. Depending on market conditions, we may purchase
from time to time additional warrants in privately negotiated or
open market transactions, by tender offer or otherwise.
Securities Issuances
In March 2011, the Company issued 25,010 shares of Class A,
Series I Preferred Stock, with a par value of $2.5 billion to
Wachovia Capital Trust III (Trust), an unconsolidated wholly
owned trust. The Trust used the proceeds from the remarketing
of certain junior subordinated notes issued in connection with
Wachovia’s 2006 issuance of 5.80% fixed-to-floating rate trust
preferred securities to purchase the Series I Preferred Stock. The
action completed the Company’s and the Trust’s obligations
under an agreement dated February 1, 2006, as amended,
between the Trust and the Company (as successor to Wachovia
Corporation).
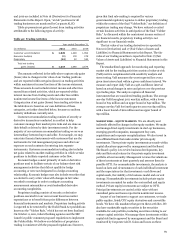
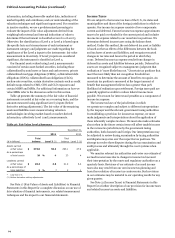
Table 44: Tier 1 Common Equity Under Basel I (1)
December 31,
(in billions)
2011
2010
Total equity
$
141.7
127.9
Noncontrolling interests
(1.5)
(1.5)
Total Wells Fargo stockholders' equity
140.2
126.4
Adjustments:
Preferred equity (2)
(10.6)
(8.1)
Goodwill and intangible assets (other than MSRs)
(34.0)
(35.5)
Applicable deferred taxes
3.8
4.3
MSRs over specified limitations
(0.8)
(0.9)
Cumulative other comprehensive income
(3.1)
(4.6)
Other
(0.4)
(0.3)
Tier 1 common equity
(A)
$
95.1
81.3
Total risk-weighted assets (3)
(B)
$
1,005.6
980.0
Tier 1 common equity to total risk-weighted assets
(A)/(B)
9.46
%
8.30
(1)
Tier 1 common equity is a non-GAAP financial measure that is used by investors, analysts and bank regulatory agencies to assess the capital position of financial services
compan
ies. Management reviews Tier 1 common equity along with other measures of capital as part of its financial analyses and has included this non-GAAP financial
information, and the corresponding reconciliation to total equity, because of current interest in such information on the part of market participants.
(2)
In March 2011, we issued $2.5 billion of Series I Preferred Stock to an unconsolidated wholly-owned trust.
(3)
Under the regulatory guidelines for risk-based capital, on-balance sheet assets and credit equivalent amounts of derivatives and off-balance sheet items are assigned to one
of several broad risk categories according to the obligor or, if relevant, the guarantor or the nature of any collateral. The
aggregate dollar amount in each risk category is
then multiplied by the risk weight associated with that category. The resulting weighted values from each of the risk categor
ies are aggregated for determining total risk-
weighted assets.
Table 45: Tier 1 Common Equity Under Basel III (Estimated) (1)
December 31,
(in billions)
2011
Tier 1 common equity under Basel I
$
95.1
Adjustments from Basel I to Basel III:
Cumulative other comprehensive income (2)
3.1
Threshold deductions defined under Basel III (2) (3)
(0.1)
Other
(0.2)
Tier 1 common equity under Basel III
(C)
$
97.9
Total risk-weighted assets anticipated under Basel III (4)
(D)
$
1,304.7
Tier 1 common equity to total risk-weighted assets anticipated under Basel III
(C)/(D)
7.50
%
(1)
Tier 1 common equity is a non-GAAP financial measure that is used by investors, analysts and bank regulatory agencies to assess the capital position of financial services
companies. Management reviews Tier 1 common equity along with other measures of capital as part of its financial analyses and
has included this non-GAAP financial
information, and the corresponding reconciliation to total equity, because of current interest in such information on the part of market participants.
(2)
Volatility in interest rates can have a significant impact on the valuation of cumulative other comprehensive income and MSRs and therefore, impact adjustments under
Basel III in future reporting periods.
(3)
Threshold deductions under Basel III include individual and aggregate limitations, as a percentage of Tier 1 common equity (as defined under Basel III), with respect to
MSRs, deferred tax assets and investments in unconsolidated financial companies.
(4)
Under current Basel proposals, risk-weighted assets incorporate different classifications of assets, with certain risk weights based on a borrower's credit rating or Wells
Fargo's o
wn risk models, along with adjustments to address a combination of credit/counterparty, operational and market risks, and other Basel III elements. The
amount of risk
-weighted assets anticipated under Basel III is preliminary and subject to change depending on final promulgation of Basel III capital rulemaking and
interpretations thereof by regulatory authorities.
86