Wells Fargo 2011 Annual Report Download - page 116
Download and view the complete annual report
Please find page 116 of the 2011 Wells Fargo annual report below. You can navigate through the pages in the report by either clicking on the pages listed below, or by using the keyword search tool below to find specific information within the annual report.-
 1
1 -
2
-
3
-
4
-
5
-
6
-
7
-
8
-
9
-
10
-
11
-
12
-
13
-
14
-
15
-
16
-
17
-
18
-
19
-
20
-
21
-
22
-
23
-
24
-
25
-
26
-
27
-
28
-
29
-
30
-
31
-
32
-
33
-
34
-
35
-
36
-
37
-
38
-
39
-
40
-
41
-
42
-
43
-
44
-
45
-
46
-
47
-
48
-
49
-
50
-
51
-
52
-
53
-
54
-
55
-
56
-
57
-
58
-
59
-
60
-
61
-
62
-
63
-
64
-
65
-
66
-
67
-
68
-
69
-
70
-
71
-
72
-
73
-
74
-
75
-
76
-
77
-
78
-
79
-
80
-
81
-
82
-
83
-
84
-
85
-
86
-
87
-
88
-
89
-
90
-
91
-
92
-
93
-
94
-
95
-
96
-
97
-
98
-
99
-
100
-
101
-
102
-
103
-
104
-
105
-
 106
106 -
 107
107 -
 108
108 -
 109
109 -
 110
110 -
 111
111 -
 112
112 -
 113
113 -
 114
114 -
 115
115 -
 116
116 -
 117
117 -
 118
118 -
 119
119 -
 120
120 -
 121
121 -
 122
122 -
 123
123 -
 124
124 -
 125
125 -
 126
126 -
127
-
128
-
129
-
130
-
131
-
132
-
133
-
134
-
135
-
136
-
137
-
138
-
139
-
140
-
141
-
142
-
143
-
144
-
145
-
146
-
147
-
148
-
149
-
150
-
151
-
152
-
153
-
154
-
155
-
156
-
157
-
158
-
159
-
160
-
161
-
162
-
163
-
164
-
165
-
166
-
167
-
168
-
169
-
170
-
171
-
172
-
173
-
174
-
175
-
176
-
177
-
178
-
179
-
180
-
181
-
182
-
183
-
184
-
185
-
186
-
187
-
188
-
189
-
190
-
191
-
192
-
193
-
194
-
195
-
196
-
197
-
198
-
199
-
200
-
201
-
202
-
203
-
204
-
205
-
206
-
207
-
208
-
209
-
210
-
211
-
212
-
213
-
214
-
215
-
216
-
217
-
218
-
219
-
220
-
221
-
222
-
223
-
224
-
225
-
226
-
227
-
228
-
229
-
230
-
231
-
232
-
233
-
234
-
235
-
236
-
237
-
238
-
239
-
240
 |
 |

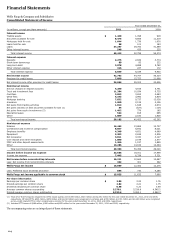
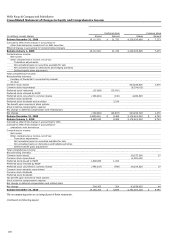
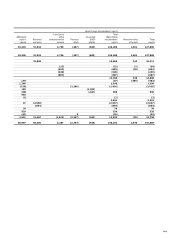
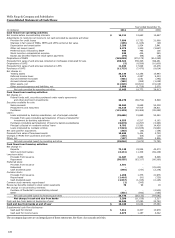
Financial Statements
Wells Fargo & Company and Subsidiaries
Consolidated Statement of Income
Year ended December 31,
(in millions, except per share amounts)
2011
2010
2009
Interest income
Trading assets
$
1,440
1,098
918
Securities available for sale
8,475
9,666
11,319
Mortgages held for sale
1,644
1,736
1,930
Loans held for sale
58
101
183
Loans
37,247
39,760
41,589
Other interest income
548
435
335
Total interest income
49,412
52,796
56,274
Interest expense
Deposits
2,275
2,832
3,774
Short-term borrowings
80
92
222
Long-term debt
3,978
4,888
5,782
Other interest expense
316
227
172
Total interest expense
6,649
8,039
9,950
Net interest income
42,763
44,757
46,324
Provision for credit losses
7,899
15,753
21,668
Net interest income after provision for credit losses
34,864
29,004
24,656
Noninterest income
Service charges on deposit accounts
4,280
4,916
5,741
Trust and investment fees
11,304
10,934
9,735
Card fees
3,653
3,652
3,683
Other fees
4,193
3,990
3,804
Mortgage banking
7,832
9,737
12,028
Insurance
1,960
2,126
2,126
Net gains from trading activities
1,014
1,648
2,674
Net gains (losses) on debt securities available for sale (1)
54
(324)
(127)
Net gains from equity investments (2)
1,482
779
185
Operating leases
524
815
685
Other
1,889
2,180
1,828
Total noninterest income
38,185
40,453
42,362
Noninterest expense
Salaries
14,462
13,869
13,757
Commission and incentive compensation
8,857
8,692
8,021
Employee benefits
4,348
4,651
4,689
Equipment
2,283
2,636
2,506
Net occupancy
3,011
3,030
3,127
Core deposit and other intangibles
1,880
2,199
2,577
FDIC and other deposit assessments
1,266
1,197
1,849
Other
13,286
14,182
12,494
Total noninterest expense
49,393
50,456
49,020
Income before income tax expense
23,656
19,001
17,998
Income tax expense
7,445
6,338
5,331
Net income before noncontrolling interests
16,211
12,663
12,667
Less: Net income from noncontrolling interests
342
301
392
Wells Fargo net income
$
15,869
12,362
12,275
Less: Preferred stock dividends and other
844
730
4,285
Wells Fargo net income applicable to common stock
$
15,025
11,632
7,990
Per share information
Earnings per common share
$
2.85
2.23
1.76
Diluted earnings per common share
2.82
2.21
1.75
Dividends declared per common share
0.48
0.20
0.49
Average common shares outstanding
5,278.1
5,226.8
4,545.2
Diluted average common shares outstanding
5,323.4
5,263.1
4,562.7
(1) Total other-than-temporary impairment (OTTI) losses (gains) were $349 million, $500 million and $2,352 million for the year ended December 31, 2011, 2010 and 2009,
respectively. Of total OTTI, $423 million, $672 million and $1,012 million were recognized in earnings, and $(74) million, $(172) million and $1,340 million were recognized
as non-credit related OTTI in other comprehensive income for the year ended December 31, 2011, 2010 and 2009, respectively.
(2) Includes OTTI losses of $288 million, $268 million and $655 million for the year ended December 31, 2011, 2010 and 2009, respectively.
The accompanying notes are an integral part of these statements.
114