Wells Fargo 2011 Annual Report Download - page 215
Download and view the complete annual report
Please find page 215 of the 2011 Wells Fargo annual report below. You can navigate through the pages in the report by either clicking on the pages listed below, or by using the keyword search tool below to find specific information within the annual report.-
 1
1 -
2
-
3
-
4
-
5
-
6
-
7
-
8
-
9
-
10
-
11
-
12
-
13
-
14
-
15
-
16
-
17
-
18
-
19
-
20
-
21
-
22
-
23
-
24
-
25
-
26
-
27
-
28
-
29
-
30
-
31
-
32
-
33
-
34
-
35
-
36
-
37
-
38
-
39
-
40
-
41
-
42
-
43
-
44
-
45
-
46
-
47
-
48
-
49
-
50
-
51
-
52
-
53
-
54
-
55
-
56
-
57
-
58
-
59
-
60
-
61
-
62
-
63
-
64
-
65
-
66
-
67
-
68
-
69
-
70
-
71
-
72
-
73
-
74
-
75
-
76
-
77
-
78
-
79
-
80
-
81
-
82
-
83
-
84
-
85
-
86
-
87
-
88
-
89
-
90
-
91
-
92
-
93
-
94
-
95
-
96
-
97
-
98
-
99
-
100
-
101
-
102
-
103
-
104
-
105
-
106
-
107
-
108
-
109
-
110
-
111
-
112
-
113
-
114
-
115
-
116
-
117
-
118
-
119
-
120
-
121
-
122
-
123
-
124
-
125
-
126
-
127
-
128
-
129
-
130
-
131
-
132
-
133
-
134
-
135
-
136
-
137
-
138
-
139
-
140
-
141
-
142
-
143
-
144
-
145
-
146
-
147
-
148
-
149
-
150
-
151
-
152
-
153
-
154
-
155
-
156
-
157
-
158
-
159
-
160
-
161
-
162
-
163
-
164
-
165
-
166
-
167
-
168
-
169
-
170
-
171
-
172
-
173
-
174
-
175
-
176
-
177
-
178
-
179
-
180
-
181
-
182
-
183
-
184
-
185
-
186
-
187
-
188
-
189
-
190
-
191
-
192
-
193
-
194
-
195
-
196
-
197
-
198
-
199
-
200
-
201
-
202
-
203
-
204
-
 205
205 -
 206
206 -
 207
207 -
 208
208 -
 209
209 -
 210
210 -
 211
211 -
 212
212 -
 213
213 -
 214
214 -
 215
215 -
 216
216 -
 217
217 -
 218
218 -
 219
219 -
 220
220 -
 221
221 -
 222
222 -
 223
223 -
 224
224 -
 225
225 -
226
-
227
-
228
-
229
-
230
-
231
-
232
-
233
-
234
-
235
-
236
-
237
-
238
-
239
-
240
 |
 |

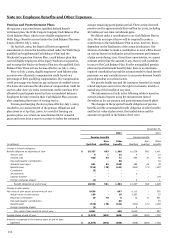
The accumulated benefit obligation for the defined benefit
pension plans was $11.3 billion and $11.0 billion at
December 31, 2011 and 2010, respectively.
The following table provides information for pension plans
with benefit obligations in excess of plan assets.
December 31,
(in millions)
2011
2010
Projected benefit obligation
$
11,325
11,030
Accumulated benefit obligation
11,321
11,019
Fair value of plan assets
9,061
9,639
The components of net periodic benefit cost were:
Year ended December 31,
2011
2010
2009
Pension benefits
Pension benefits
Pension benefits
Non-
Other
Non-
Other
Non-
Other
(in millions)
Qualified
qualified
benefits
Qualified
qualified
benefits
Qualified
qualified
benefits
Service cost
$
6
1
13
5
-
13
210
8
13
Interest cost
520
34
71
554
37
78
595
43
83
Expected return on plan assets
(759)
-
(41)
(717)
-
(29)
(643)
-
(29)
Amortization of net actuarial loss
86
6
-
105
3
1
194
2
3
Amortization of prior service cost
-
-
(3)
-
-
(4)
-
(1)
(3)
Settlement Loss
4
3
-
-
-
-
-
-
-
Curtailment loss (gain)
-
-
-
3
-
(4)
(32)
(33)
-
Net periodic benefit cost
(143)
44
40
(50)
40
55
324
19
67
Other changes in plan assets
and benefit obligations
recognized in other
comprehensive income:
Net actuarial loss (gain)
1,120
33
(74)
(59)
46
(9)
(346)
25
99
Amortization of net actuarial loss
(86)
(6)
-
(105)
(3)
(1)
(194)
(2)
(3)
Prior service cost
-
-
-
2
-
-
-
-
-
Amortization of prior service cost
-
-
3
-
-
4
-
1
3
Settlement
(4)
(3)
-
-
-
-
-
-
-
Curtailment
(3)
-
-
(3)
-
4
32
33
-
Net gain on amendment
-
-
-
-
-
-
-
-
(54)
Translation adjustments
(1)
-
-
-
-
-
3
-
2
Total recognized in other
comprehensive income
1,026
24
(71)
(165)
43
(2)
(505)
57
47
Total recognized in net periodic
benefit cost and other
comprehensive income
$
883
68
(31)
(215)
83
53
(181)
76
114
213