Wells Fargo 2011 Annual Report Download - page 170
Download and view the complete annual report
Please find page 170 of the 2011 Wells Fargo annual report below. You can navigate through the pages in the report by either clicking on the pages listed below, or by using the keyword search tool below to find specific information within the annual report.-
 1
1 -
2
-
3
-
4
-
5
-
6
-
7
-
8
-
9
-
10
-
11
-
12
-
13
-
14
-
15
-
16
-
17
-
18
-
19
-
20
-
21
-
22
-
23
-
24
-
25
-
26
-
27
-
28
-
29
-
30
-
31
-
32
-
33
-
34
-
35
-
36
-
37
-
38
-
39
-
40
-
41
-
42
-
43
-
44
-
45
-
46
-
47
-
48
-
49
-
50
-
51
-
52
-
53
-
54
-
55
-
56
-
57
-
58
-
59
-
60
-
61
-
62
-
63
-
64
-
65
-
66
-
67
-
68
-
69
-
70
-
71
-
72
-
73
-
74
-
75
-
76
-
77
-
78
-
79
-
80
-
81
-
82
-
83
-
84
-
85
-
86
-
87
-
88
-
89
-
90
-
91
-
92
-
93
-
94
-
95
-
96
-
97
-
98
-
99
-
100
-
101
-
102
-
103
-
104
-
105
-
106
-
107
-
108
-
109
-
110
-
111
-
112
-
113
-
114
-
115
-
116
-
117
-
118
-
119
-
120
-
121
-
122
-
123
-
124
-
125
-
126
-
127
-
128
-
129
-
130
-
131
-
132
-
133
-
134
-
135
-
136
-
137
-
138
-
139
-
140
-
141
-
142
-
143
-
144
-
145
-
146
-
147
-
148
-
149
-
150
-
151
-
152
-
153
-
154
-
155
-
156
-
157
-
158
-
159
-
 160
160 -
 161
161 -
 162
162 -
 163
163 -
 164
164 -
 165
165 -
 166
166 -
 167
167 -
 168
168 -
 169
169 -
 170
170 -
 171
171 -
 172
172 -
 173
173 -
 174
174 -
 175
175 -
 176
176 -
 177
177 -
 178
178 -
 179
179 -
 180
180 -
181
-
182
-
183
-
184
-
185
-
186
-
187
-
188
-
189
-
190
-
191
-
192
-
193
-
194
-
195
-
196
-
197
-
198
-
199
-
200
-
201
-
202
-
203
-
204
-
205
-
206
-
207
-
208
-
209
-
210
-
211
-
212
-
213
-
214
-
215
-
216
-
217
-
218
-
219
-
220
-
221
-
222
-
223
-
224
-
225
-
226
-
227
-
228
-
229
-
230
-
231
-
232
-
233
-
234
-
235
-
236
-
237
-
238
-
239
-
240
 |
 |

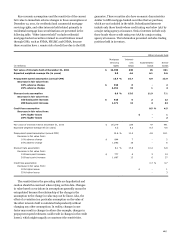
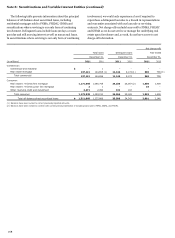
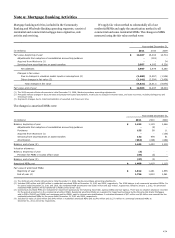
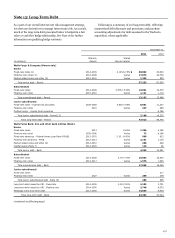
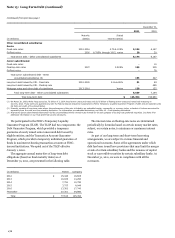
Note 8: Securitizations and Variable Interest Entities (continued)
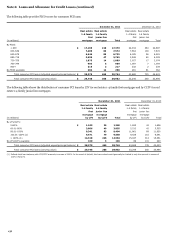
The following table presents information about the principal
balances of off-balance sheet securitized loans, including
residential mortgages sold to FNMA, FHLMC, GNMA and
securitizations where servicing is our only form of continuing
involvement. Delinquent loans include loans 90 days or more
past due and still accruing interest as well as nonaccrual loans.
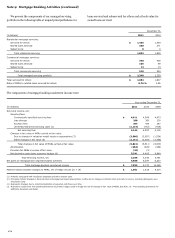
In securitizations where servicing is our only form of continuing
involvement, we would only experience a loss if required to
repurchase a delinquent loan due to a breach in representations
and warranties associated with our loan sale or servicing
contracts. Net charge-offs exclude loans sold to FNMA, FHLMC
and GNMA as we do not service or manage the underlying real
estate upon foreclosure and, as such, do not have access to net
charge-off information.
Net charge-offs
Total loans
Delinquent loans
Year ended
December 31,
December 31,
December 31,
(in millions)
2011
2010
2011
2010
2011
2010
Commercial:
Commercial and industrial
$
-
1
-
-
-
-
Real estate mortgage
137,121
144,655
(1)
11,142
9,174
(1)
569
738
(1)
Total commercial
137,121
144,656
11,142
9,174
569
738
Consumer:
Real estate 1-4 family first mortgage
1,171,666
1,090,755
24,235
25,067
(2)
1,506
1,408
Real estate 1-4 family junior lien mortgage
2
1
-
-
16
-
Other revolving credit and installment
2,271
2,454
131
102
-
-
Total consumer
1,173,939
1,093,210
24,366
25,169
1,522
1,408
Total off-balance sheet securitized loans
$
1,311,060
1,237,866
35,508
34,343
2,091
2,146
(1) Balances have been revised to correct previously reported amounts.
(2) Balances have been revised to conform with current period presentation of including loans sold to FNMA, GNMA, and FHLMC.
168