Wells Fargo 2011 Annual Report Download - page 135
Download and view the complete annual report
Please find page 135 of the 2011 Wells Fargo annual report below. You can navigate through the pages in the report by either clicking on the pages listed below, or by using the keyword search tool below to find specific information within the annual report.-
 1
1 -
2
-
3
-
4
-
5
-
6
-
7
-
8
-
9
-
10
-
11
-
12
-
13
-
14
-
15
-
16
-
17
-
18
-
19
-
20
-
21
-
22
-
23
-
24
-
25
-
26
-
27
-
28
-
29
-
30
-
31
-
32
-
33
-
34
-
35
-
36
-
37
-
38
-
39
-
40
-
41
-
42
-
43
-
44
-
45
-
46
-
47
-
48
-
49
-
50
-
51
-
52
-
53
-
54
-
55
-
56
-
57
-
58
-
59
-
60
-
61
-
62
-
63
-
64
-
65
-
66
-
67
-
68
-
69
-
70
-
71
-
72
-
73
-
74
-
75
-
76
-
77
-
78
-
79
-
80
-
81
-
82
-
83
-
84
-
85
-
86
-
87
-
88
-
89
-
90
-
91
-
92
-
93
-
94
-
95
-
96
-
97
-
98
-
99
-
100
-
101
-
102
-
103
-
104
-
105
-
106
-
107
-
108
-
109
-
110
-
111
-
112
-
113
-
114
-
115
-
116
-
117
-
118
-
119
-
120
-
121
-
122
-
123
-
124
-
 125
125 -
 126
126 -
 127
127 -
 128
128 -
 129
129 -
 130
130 -
 131
131 -
 132
132 -
 133
133 -
 134
134 -
 135
135 -
 136
136 -
 137
137 -
 138
138 -
 139
139 -
 140
140 -
 141
141 -
 142
142 -
 143
143 -
 144
144 -
 145
145 -
146
-
147
-
148
-
149
-
150
-
151
-
152
-
153
-
154
-
155
-
156
-
157
-
158
-
159
-
160
-
161
-
162
-
163
-
164
-
165
-
166
-
167
-
168
-
169
-
170
-
171
-
172
-
173
-
174
-
175
-
176
-
177
-
178
-
179
-
180
-
181
-
182
-
183
-
184
-
185
-
186
-
187
-
188
-
189
-
190
-
191
-
192
-
193
-
194
-
195
-
196
-
197
-
198
-
199
-
200
-
201
-
202
-
203
-
204
-
205
-
206
-
207
-
208
-
209
-
210
-
211
-
212
-
213
-
214
-
215
-
216
-
217
-
218
-
219
-
220
-
221
-
222
-
223
-
224
-
225
-
226
-
227
-
228
-
229
-
230
-
231
-
232
-
233
-
234
-
235
-
236
-
237
-
238
-
239
-
240
 |
 |

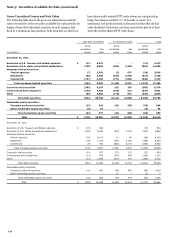
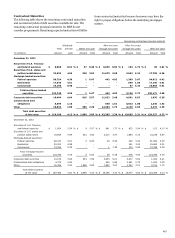
Note 5: Securities Available for Sale
The following table provides the cost and fair value for the major
categories of securities available for sale carried at fair value.
There were no securities classified as held to maturity as of the
periods presented.
Gross
Gross
unrealized
unrealized
Fair
(in millions)
Cost
gains
losses
value
December 31, 2011
Securities of U.S. Treasury and federal agencies
$
6,920
59
(11)
6,968
Securities of U.S. states and political subdivisions
32,307
1,169
(883)
32,593
Mortgage-backed securities:
Federal agencies
92,279
4,485
(10)
96,754
Residential
16,997
1,253
(414)
17,836
Commercial
17,829
1,249
(928)
18,150
Total mortgage-backed securities
127,105
6,987
(1,352)
132,740
Corporate debt securities
17,921
769
(286)
18,404
Collateralized debt obligations (1)
8,650
298
(349)
8,599
Other (2)
19,739
378
(225)
19,892
Total debt securities
212,642
9,660
(3,106)
219,196
Marketable equity securities:
Perpetual preferred securities
2,396
185
(54)
2,527
Other marketable equity securities
533
366
(9)
890
Total marketable equity securities
2,929
551
(63)
3,417
Total (3)
$
215,571
10,211
(3,169)
222,613
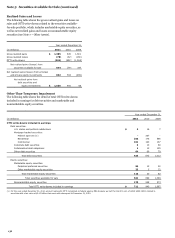
December 31, 2010
Securities of U.S. Treasury and federal agencies
$
1,570
49
(15)
1,604
Securities of U.S. states and political subdivisions
18,923
568
(837)
18,654
Mortgage-backed securities:
Federal agencies
78,578
3,555
(96)
82,037
Residential
18,294
2,398
(489)
20,203
Commercial
12,990
1,199
(635)
13,554
Total mortgage-backed securities
109,862
7,152
(1,220)
115,794
Corporate debt securities
9,015
1,301
(37)
10,279
Collateralized debt obligations (1)
4,638
369
(229)
4,778
Other (2)
16,063
576
(283)
16,356
Total debt securities
160,071
10,015
(2,621)
167,465
Marketable equity securities:
Perpetual preferred securities
3,671
250
(89)
3,832
Other marketable equity securities
587
771
(1)
1,357
Total marketable equity securities
4,258
1,021
(90)
5,189
Total (3)
$
164,329
11,036
(2,711)
172,654
(1) Includes collateralized loan obligations with both a cost basis and fair value of $8.1 billion, at December 31, 2011, and $4.0 billion and $4.2 billion, respectively, at
December 31, 2010.
(2) Included in the “Other” category are asset-backed securities collateralized by auto leases or loans and cash reserves with a cost basis and fair value of $6.7 billion each at
December 31, 2011, and $6.2 billion and $6.4 billion, respectively, at December 31, 2010. Also included in the "Other" category are asset-backed securities collateralized by
home equity loans with a cost basis and fair value of $846 million and $932 million, respectively, at December 31, 2011, and $927 million and $1.1 billion, respectively, at
December 31, 2010. The remaining balances primarily include asset-backed securities collateralized by credit cards and student loans.
(3) At December 31, 2011 and 2010, we held no securities of any single issuer (excluding the U.S. Treasury and federal agencies) with a book value that exceeded 10% of
stockholders’ equity.
133