Wells Fargo 2011 Annual Report Download - page 153
Download and view the complete annual report
Please find page 153 of the 2011 Wells Fargo annual report below. You can navigate through the pages in the report by either clicking on the pages listed below, or by using the keyword search tool below to find specific information within the annual report.-
 1
1 -
2
-
3
-
4
-
5
-
6
-
7
-
8
-
9
-
10
-
11
-
12
-
13
-
14
-
15
-
16
-
17
-
18
-
19
-
20
-
21
-
22
-
23
-
24
-
25
-
26
-
27
-
28
-
29
-
30
-
31
-
32
-
33
-
34
-
35
-
36
-
37
-
38
-
39
-
40
-
41
-
42
-
43
-
44
-
45
-
46
-
47
-
48
-
49
-
50
-
51
-
52
-
53
-
54
-
55
-
56
-
57
-
58
-
59
-
60
-
61
-
62
-
63
-
64
-
65
-
66
-
67
-
68
-
69
-
70
-
71
-
72
-
73
-
74
-
75
-
76
-
77
-
78
-
79
-
80
-
81
-
82
-
83
-
84
-
85
-
86
-
87
-
88
-
89
-
90
-
91
-
92
-
93
-
94
-
95
-
96
-
97
-
98
-
99
-
100
-
101
-
102
-
103
-
104
-
105
-
106
-
107
-
108
-
109
-
110
-
111
-
112
-
113
-
114
-
115
-
116
-
117
-
118
-
119
-
120
-
121
-
122
-
123
-
124
-
125
-
126
-
127
-
128
-
129
-
130
-
131
-
132
-
133
-
134
-
135
-
136
-
137
-
138
-
139
-
140
-
141
-
142
-
 143
143 -
 144
144 -
 145
145 -
 146
146 -
 147
147 -
 148
148 -
 149
149 -
 150
150 -
 151
151 -
 152
152 -
 153
153 -
 154
154 -
 155
155 -
 156
156 -
 157
157 -
 158
158 -
 159
159 -
 160
160 -
 161
161 -
 162
162 -
 163
163 -
164
-
165
-
166
-
167
-
168
-
169
-
170
-
171
-
172
-
173
-
174
-
175
-
176
-
177
-
178
-
179
-
180
-
181
-
182
-
183
-
184
-
185
-
186
-
187
-
188
-
189
-
190
-
191
-
192
-
193
-
194
-
195
-
196
-
197
-
198
-
199
-
200
-
201
-
202
-
203
-
204
-
205
-
206
-
207
-
208
-
209
-
210
-
211
-
212
-
213
-
214
-
215
-
216
-
217
-
218
-
219
-
220
-
221
-
222
-
223
-
224
-
225
-
226
-
227
-
228
-
229
-
230
-
231
-
232
-
233
-
234
-
235
-
236
-
237
-
238
-
239
-
240
 |
 |

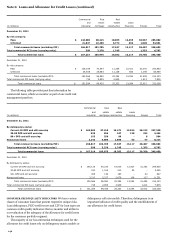
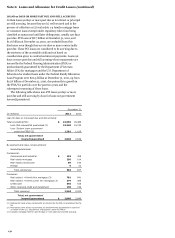
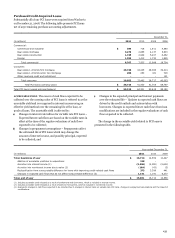
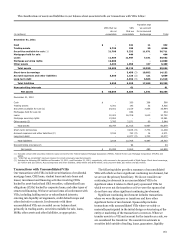
IMPAIRED LOANS
The table below summarizes key information
for impaired loans. Our impaired loans predominately include
loans on nonaccrual status in the commercial portfolio segment
and loans modified in a TDR, whether on accrual or nonaccrual
status. These impaired loans may have estimated loss which is
included in the allowance for credit losses. Impaired loans
exclude PCI loans. Upon our adoption of ASU No. 2011-02 in
third quarter 2011, we identified commercial loans that were not
previously included as impaired loans, which totaled
$685 million with an associated allowance for credit losses of
$54 million. The allowance for credit losses associated with these
loans would have been measured under a collectively evaluated
basis prior to adoption, but is now estimated on an individually
evaluated basis. Our consumer loans were not impacted by the
adoption of ASU No. 2011-02. Additionally, based on clarifying
guidance from the Securities and Exchange Commission (SEC)
received in December 2011, we now classify trial modifications
as TDRs at the beginning of the trial period. The table below
includes trial modifications that totaled $651 million at
December 31, 2011. See the “Loans” section in Note 1 for our
policies on impaired loans and PCI loans.
Recorded investment
Impaired loans
Unpaid
with related
Related
principal
Impaired
allowance for
allowance for
(in millions)
balance
loans
credit losses
credit losses
December 31, 2011
Commercial:
Commercial and industrial
$
7,191
3,072
3,018
501
Real estate mortgage
7,490
5,114
4,637
1,133
Real estate construction
4,733
2,281
2,281
470
Lease financing
127
68
68
21
Foreign
185
31
31
8
Total commercial
19,726
10,566
10,035
2,133
Consumer:
Real estate 1-4 family first mortgage
16,494
14,486
13,909
3,380
Real estate 1-4 family junior lien mortgage
2,232
2,079
2,079
784
Credit card
593
593
593
339
Other revolving credit and installment
287
286
274
42
Total consumer
19,606
17,444
16,855
4,545
Total impaired loans (excluding PCI)
$
39,332
28,010
26,890
6,678
December 31, 2010
Commercial:
Commercial and industrial
$
8,190
3,600
3,276
607
Real estate mortgage
7,439
5,239
5,163
1,282
Real estate construction
4,676
2,786
2,786
548
Lease financing
149
91
91
34
Foreign
215
15
15
8
Total commercial
20,669
11,731
11,331
2,479
Consumer:
Real estate 1-4 family first mortgage
12,834
11,603
11,603
2,754
Real estate 1-4 family junior lien mortgage
1,759
1,626
1,626
578
Credit card
548
548
548
333
Other revolving credit and installment
231
230
230
58
Total consumer
15,372
14,007
14,007
3,723
Total impaired loans (excluding PCI)
$
36,041
25,738
25,338
6,202
151