Wells Fargo 2011 Annual Report Download - page 139
Download and view the complete annual report
Please find page 139 of the 2011 Wells Fargo annual report below. You can navigate through the pages in the report by either clicking on the pages listed below, or by using the keyword search tool below to find specific information within the annual report.-
 1
1 -
2
-
3
-
4
-
5
-
6
-
7
-
8
-
9
-
10
-
11
-
12
-
13
-
14
-
15
-
16
-
17
-
18
-
19
-
20
-
21
-
22
-
23
-
24
-
25
-
26
-
27
-
28
-
29
-
30
-
31
-
32
-
33
-
34
-
35
-
36
-
37
-
38
-
39
-
40
-
41
-
42
-
43
-
44
-
45
-
46
-
47
-
48
-
49
-
50
-
51
-
52
-
53
-
54
-
55
-
56
-
57
-
58
-
59
-
60
-
61
-
62
-
63
-
64
-
65
-
66
-
67
-
68
-
69
-
70
-
71
-
72
-
73
-
74
-
75
-
76
-
77
-
78
-
79
-
80
-
81
-
82
-
83
-
84
-
85
-
86
-
87
-
88
-
89
-
90
-
91
-
92
-
93
-
94
-
95
-
96
-
97
-
98
-
99
-
100
-
101
-
102
-
103
-
104
-
105
-
106
-
107
-
108
-
109
-
110
-
111
-
112
-
113
-
114
-
115
-
116
-
117
-
118
-
119
-
120
-
121
-
122
-
123
-
124
-
125
-
126
-
127
-
128
-
 129
129 -
 130
130 -
 131
131 -
 132
132 -
 133
133 -
 134
134 -
 135
135 -
 136
136 -
 137
137 -
 138
138 -
 139
139 -
 140
140 -
 141
141 -
 142
142 -
 143
143 -
 144
144 -
 145
145 -
 146
146 -
 147
147 -
 148
148 -
 149
149 -
150
-
151
-
152
-
153
-
154
-
155
-
156
-
157
-
158
-
159
-
160
-
161
-
162
-
163
-
164
-
165
-
166
-
167
-
168
-
169
-
170
-
171
-
172
-
173
-
174
-
175
-
176
-
177
-
178
-
179
-
180
-
181
-
182
-
183
-
184
-
185
-
186
-
187
-
188
-
189
-
190
-
191
-
192
-
193
-
194
-
195
-
196
-
197
-
198
-
199
-
200
-
201
-
202
-
203
-
204
-
205
-
206
-
207
-
208
-
209
-
210
-
211
-
212
-
213
-
214
-
215
-
216
-
217
-
218
-
219
-
220
-
221
-
222
-
223
-
224
-
225
-
226
-
227
-
228
-
229
-
230
-
231
-
232
-
233
-
234
-
235
-
236
-
237
-
238
-
239
-
240
 |
 |

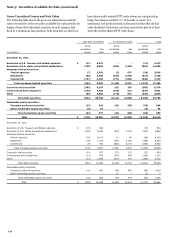
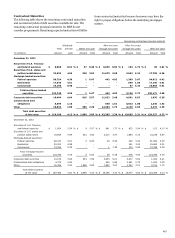
Contractual Maturities
The following table shows the remaining contractual maturities
and contractual yields of debt securities available for sale. The
remaining contractual principal maturities for MBS do not
consider prepayments. Remaining expected maturities will differ
from contractual maturities because borrowers may have the
right to prepay obligations before the underlying mortgages
mature.
Remaining contractual principal maturity
Weighted-
After one year
After five years
Total
average
Within one year
through five years
through ten years
After ten years
(in millions)
amount
yield
Amount
Yield
Amount
Yield
Amount
Yield
Amount
Yield
December 31, 2011
Securities of U.S. Treasury
and federal agencies
$
6,968
0.91
%
$
57
0.48
%
$
6,659
0.84
%
$
194
2.73
%
$
58
3.81
%
Securities of U.S. states and
political subdivisions
32,593
4.94
520
3.02
11,679
2.90
2,692
5.31
17,702
6.28
Mortgage-backed securities:
Federal agencies
96,754
4.39
1
6.47
442
4.02
1,399
3.07
94,912
4.42
Residential
17,836
4.51
-
-
-
-
640
1.88
17,196
4.61
Commercial
18,150
5.40
-
-
-
-
87
3.33
18,063
5.41
Total mortgage-backed
securities
132,740
4.55
1
6.47
442
4.02
2,126
2.72
130,171
4.58
Corporate debt securities
18,404
4.64
815
5.57
11,022
3.40
4,691
6.67
1,876
6.38
Collateralized debt
obligations
8,599
1.10
-
-
540
1.61
6,813
1.00
1,246
1.42
Other
19,892
1.89
506
2.29
12,963
1.75
3,149
2.04
3,274
2.29
Total debt securities
at fair value
$
219,196
4.12
%
$
1,899
3.85
%
$
43,305
2.36
%
$
19,665
3.31
%
$
154,327
4.72
%
December 31, 2010
Securities of U.S. Treasury
and federal agencies
$
1,604
2.54
%
$
9
5.07
%
$
641
1.72
%
$
852
2.94
%
$
102
4.15
%
Securities of U.S. states and
political subdivisions
18,654
5.99
322
3.83
3,210
3.57
1,884
6.13
13,238
6.60
Mortgage-backed securities:
Federal agencies
82,037
5.01
5
6.63
28
6.58
420
5.23
81,584
5.00
Residential
20,203
4.98
-
-
-
-
341
3.20
19,862
5.01
Commercial
13,554
5.39
-
-
1
1.38
215
5.28
13,338
5.39
Total mortgage-backed
securities
115,794
5.05
5
6.63
29
6.38
976
4.53
114,784
5.05
Corporate debt securities
10,279
5.94
545
7.82
3,853
6.01
4,817
5.62
1,064
6.21
Collateralized debt obligations
4,778
0.80
-
-
545
0.88
2,581
0.72
1,652
0.90
Other
16,356
2.53
1,588
2.89
7,887
3.00
4,367
2.01
2,514
1.72
Total debt securities
at fair value
$
167,465
4.81
%
$
2,469
4.12
%
$
16,165
3.72
%
$
15,477
3.63
%
$
133,354
5.10
%
137