Wells Fargo 2011 Annual Report Download - page 214
Download and view the complete annual report
Please find page 214 of the 2011 Wells Fargo annual report below. You can navigate through the pages in the report by either clicking on the pages listed below, or by using the keyword search tool below to find specific information within the annual report.-
 1
1 -
2
-
3
-
4
-
5
-
6
-
7
-
8
-
9
-
10
-
11
-
12
-
13
-
14
-
15
-
16
-
17
-
18
-
19
-
20
-
21
-
22
-
23
-
24
-
25
-
26
-
27
-
28
-
29
-
30
-
31
-
32
-
33
-
34
-
35
-
36
-
37
-
38
-
39
-
40
-
41
-
42
-
43
-
44
-
45
-
46
-
47
-
48
-
49
-
50
-
51
-
52
-
53
-
54
-
55
-
56
-
57
-
58
-
59
-
60
-
61
-
62
-
63
-
64
-
65
-
66
-
67
-
68
-
69
-
70
-
71
-
72
-
73
-
74
-
75
-
76
-
77
-
78
-
79
-
80
-
81
-
82
-
83
-
84
-
85
-
86
-
87
-
88
-
89
-
90
-
91
-
92
-
93
-
94
-
95
-
96
-
97
-
98
-
99
-
100
-
101
-
102
-
103
-
104
-
105
-
106
-
107
-
108
-
109
-
110
-
111
-
112
-
113
-
114
-
115
-
116
-
117
-
118
-
119
-
120
-
121
-
122
-
123
-
124
-
125
-
126
-
127
-
128
-
129
-
130
-
131
-
132
-
133
-
134
-
135
-
136
-
137
-
138
-
139
-
140
-
141
-
142
-
143
-
144
-
145
-
146
-
147
-
148
-
149
-
150
-
151
-
152
-
153
-
154
-
155
-
156
-
157
-
158
-
159
-
160
-
161
-
162
-
163
-
164
-
165
-
166
-
167
-
168
-
169
-
170
-
171
-
172
-
173
-
174
-
175
-
176
-
177
-
178
-
179
-
180
-
181
-
182
-
183
-
184
-
185
-
186
-
187
-
188
-
189
-
190
-
191
-
192
-
193
-
194
-
195
-
196
-
197
-
198
-
199
-
200
-
201
-
202
-
203
-
 204
204 -
 205
205 -
 206
206 -
 207
207 -
 208
208 -
 209
209 -
 210
210 -
 211
211 -
 212
212 -
 213
213 -
 214
214 -
 215
215 -
 216
216 -
 217
217 -
 218
218 -
 219
219 -
 220
220 -
 221
221 -
 222
222 -
 223
223 -
 224
224 -
225
-
226
-
227
-
228
-
229
-
230
-
231
-
232
-
233
-
234
-
235
-
236
-
237
-
238
-
239
-
240
 |
 |

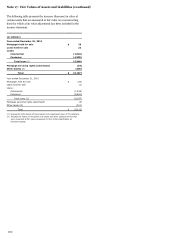
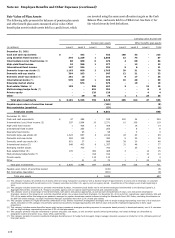
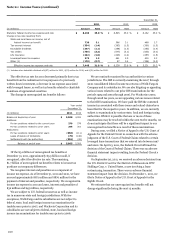
Note 20: Employee Benefits and Other Expenses
Pension and Postretirement Plans
We sponsor a noncontributory qualified defined benefit
retirement plan, the Wells Fargo & Company Cash Balance Plan
(Cash Balance Plan), which covers eligible employees of
Wells Fargo. Benefits accrued under the Cash Balance Plan were
frozen effective July 1, 2009.
On April 28, 2009, the Board of Directors approved
amendments to freeze the benefits earned under the Wells Fargo
qualified and supplemental Cash Balance Plans and the
Wachovia Corporation Pension Plan, a cash balance plan that
covered eligible employees of the legacy Wachovia Corporation,
and to merge the Wachovia Pension Plan into the qualified Cash
Balance Plan. These actions became effective on July 1, 2009.
Prior to July 1, 2009, eligible employees' cash balance plan
accounts were allocated a compensation credit based on a
percentage of their qualifying compensation. The compensation
credit percentage was based on age and years of credited service.
The freeze discontinues the allocation of compensation credit for
services after June 30, 2009. Investment credits continue to be
allocated to participants based on their accumulated balances.
Employees become vested in their Cash Balance Plan accounts
after completing three years of vesting service.
Freezing and merging the above plans effective July 1, 2009,
resulted in a re-measurement of the pension obligations and
plan assets as of April 30, 2009. As a result of freezing our
pension plans, we revised our amortization life for actuarial
gains and losses from 5 years to 13 years to reflect the estimated
average remaining participation period. These actions lowered
pension cost by approximately $500 million for 2009, including
$67 million of one-time curtailment gains.
We did not make a contribution to our Cash Balance Plan in
2011. We do not expect that we will be required to make a
contribution to the Cash Balance Plan in 2012; however, this is
dependent on the finalization of the actuarial valuation. Our
decision of whether to make a contribution in 2012 will be based
on various factors including the actual investment performance
of plan assets during 2012. Given these uncertainties, we cannot
estimate at this time the amount, if any, that we will contribute
in 2012 to the Cash Balance Plan. For the nonqualified pension
plans and postretirement benefit plans, there is no minimum
required contribution beyond the amount needed to fund benefit
payments; we may contribute more to our postretirement benefit
plans dependent on various factors.
We provide health care and life insurance benefits for certain
retired employees and reserve the right to terminate, modify or
amend any of the benefits at any time.
The information set forth in the following tables is based on
current actuarial reports using the measurement date of
December 31 for our pension and postretirement benefit plans.
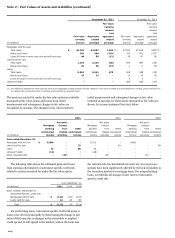
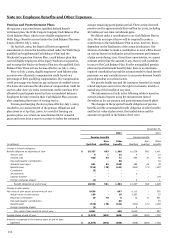
The changes in the projected benefit obligation of pension
benefits and the accumulated benefit obligation of other benefits
and the fair value of plan assets, the funded status and the
amounts recognized in the balance sheet were:
December 31,
2011
2010
Pension benefits
Pension benefits
Non-
Other
Non-
Other
(in millions)
Qualified
qualified
benefits
Qualified
qualified
benefits
Change in benefit obligation:
Benefit obligation at beginning of year
$
10,337
693
1,398
10,038
681
1,401
Service cost
6
1
13
5
-
13
Interest cost
520
34
71
554
37
78
Plan participants’ contributions
-
-
88
-
-
74
Actuarial loss (gain)
501
33
(105)
386
46
(5)
Benefits paid
(726)
(70)
(161)
(652)
(71)
(147)
Curtailment
(3)
-
-
-
-
-
Amendments
-
-
-
2
-
-
Liability transfer
-
-
-
-
-
(17)
Foreign exchange impact
(1)
-
-
4
-
1
Benefit obligation at end of year
10,634
691
1,304
10,337
693
1,398
Change in plan assets:
Fair value of plan assets at beginning of year
9,639
-
697
9,112
-
376
Actual return on plan assets
139
-
10
1,163
-
33
Employer contribution
10
70
6
12
71
361
Plan participants’ contributions
-
-
88
-
-
74
Benefits paid
(726)
(70)
(161)
(652)
(71)
(147)
Foreign exchange impact
(1)
-
-
4
-
-
Fair value of plan assets at end of year
9,061
-
640
9,639
-
697
Funded status at end of year
$
(1,573)
(691)
(664)
(698)
(693)
(701)
Amounts recognized in the balance sheet at end of year:
Liabilities
$
(1,573)
(691)
(664)
(698)
(693)
(701)
212