Wells Fargo 2011 Annual Report Download - page 63
Download and view the complete annual report
Please find page 63 of the 2011 Wells Fargo annual report below. You can navigate through the pages in the report by either clicking on the pages listed below, or by using the keyword search tool below to find specific information within the annual report.-
 1
1 -
2
-
3
-
4
-
5
-
6
-
7
-
8
-
9
-
10
-
11
-
12
-
13
-
14
-
15
-
16
-
17
-
18
-
19
-
20
-
21
-
22
-
23
-
24
-
25
-
26
-
27
-
28
-
29
-
30
-
31
-
32
-
33
-
34
-
35
-
36
-
37
-
38
-
39
-
40
-
41
-
42
-
43
-
44
-
45
-
46
-
47
-
48
-
49
-
50
-
51
-
52
-
 53
53 -
 54
54 -
 55
55 -
 56
56 -
 57
57 -
 58
58 -
 59
59 -
 60
60 -
 61
61 -
 62
62 -
 63
63 -
 64
64 -
 65
65 -
 66
66 -
 67
67 -
 68
68 -
 69
69 -
 70
70 -
 71
71 -
 72
72 -
 73
73 -
74
-
75
-
76
-
77
-
78
-
79
-
80
-
81
-
82
-
83
-
84
-
85
-
86
-
87
-
88
-
89
-
90
-
91
-
92
-
93
-
94
-
95
-
96
-
97
-
98
-
99
-
100
-
101
-
102
-
103
-
104
-
105
-
106
-
107
-
108
-
109
-
110
-
111
-
112
-
113
-
114
-
115
-
116
-
117
-
118
-
119
-
120
-
121
-
122
-
123
-
124
-
125
-
126
-
127
-
128
-
129
-
130
-
131
-
132
-
133
-
134
-
135
-
136
-
137
-
138
-
139
-
140
-
141
-
142
-
143
-
144
-
145
-
146
-
147
-
148
-
149
-
150
-
151
-
152
-
153
-
154
-
155
-
156
-
157
-
158
-
159
-
160
-
161
-
162
-
163
-
164
-
165
-
166
-
167
-
168
-
169
-
170
-
171
-
172
-
173
-
174
-
175
-
176
-
177
-
178
-
179
-
180
-
181
-
182
-
183
-
184
-
185
-
186
-
187
-
188
-
189
-
190
-
191
-
192
-
193
-
194
-
195
-
196
-
197
-
198
-
199
-
200
-
201
-
202
-
203
-
204
-
205
-
206
-
207
-
208
-
209
-
210
-
211
-
212
-
213
-
214
-
215
-
216
-
217
-
218
-
219
-
220
-
221
-
222
-
223
-
224
-
225
-
226
-
227
-
228
-
229
-
230
-
231
-
232
-
233
-
234
-
235
-
236
-
237
-
238
-
239
-
240
 |
 |

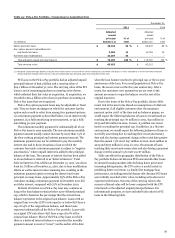
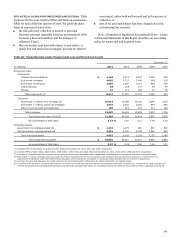
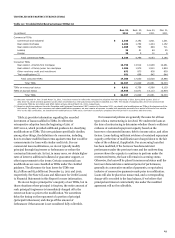
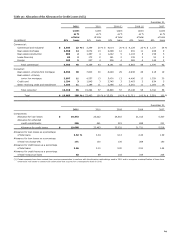
Total NPAs were $26.0 billion (3.37% of total loans) at
December 31, 2011, and included $21.3 billion of nonaccrual
loans and $4.7 billion of foreclosed assets. Nonaccrual loans
declined throughout 2011. Table 30 provides an analysis of the
changes in nonaccrual loans.
Table 30: Analysis of Changes in Nonaccrual Loans
Quarter ended
Dec. 31,
Sept. 30,
June 30,
Mar. 31,
(in millions)
2011
2011
2011
2011
Commercial nonaccrual loans
Balance, beginning of quarter
$
8,611
9,265
10,312
11,351
Inflows
1,329
1,148
1,622
1,881
Outflows:
Returned to accruing
(185)
(275)
(501)
(496)
Foreclosures
(161)
(156)
(174)
(192)
Charge-offs
(382)
(397)
(399)
(522)
Payments, sales and other (1)
(995)
(974)
(1,595)
(1,710)
Total outflows
(1,723)
(1,802)
(2,669)
(2,920)
Balance, end of quarter
8,217
8,611
9,265
10,312
Consumer nonaccrual loans
Balance, beginning of quarter
13,289
13,780
14,653
14,891
Inflows
3,465
3,544
3,443
3,955
Outflows:
Returned to accruing
(1,277)
(1,411)
(1,562)
(1,670)
Foreclosures
(209)
(286)
(221)
(269)
Charge-offs
(1,404)
(1,385)
(1,494)
(1,545)
Payments, sales and other (1)
(777)
(953)
(1,039)
(709)
Total outflows
(3,667)
(4,035)
(4,316)
(4,193)
Balance, end of quarter
13,087
13,289
13,780
14,653
Total nonaccrual loans
21,304
21,900
23,045
24,965
(1)
Other outflows include the effects of VIE deconsolidations and adjustments for loans carried at fair value.
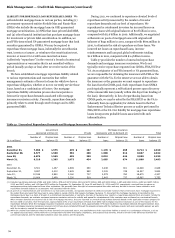
Typically, changes to nonaccrual loans period-over-period
represent inflows for loans that reach a specified past due
status, offset by reductions for loans that are charged off, sold,
transferred to foreclosed properties, or are no longer classified
as nonaccrual as a result of continued performance and an
improvement in the borrower’s financial condition and loan
repayment capabilities.
While nonaccrual loans are not free of loss content, we
believe the estimated loss exposure remaining in these
balances is significantly mitigated by four factors. First, 99% of
consumer nonaccrual loans and 96% of commercial nonaccrual
loans are secured. Of the $13.1 billion of consumer nonaccrual
loans at December 31, 2011, 99% are secured by real estate and
36% have a combined LTV (CLTV) ratio of 80% or below.
Second, losses have already been recognized on 51% of the
remaining balance of consumer nonaccruals and commercial
nonaccruals have been written down by $2.1 billion. Generally,
when a consumer real estate loan is 120 days past due, we
transfer it to nonaccrual status. When the loan reaches
180 days past due it is our policy to write these loans down to
net realizable value (fair value of collateral less estimated costs
to sell), except for modifications in their trial period that are
not written down as long as trial payments are made on time.
Thereafter, we revalue each loan regularly and recognize
additional write-downs if needed. Third, as of
December 31, 2011, 58% of commercial nonaccrual loans were
current on interest. Fourth, the risk of loss for all nonaccruals
has been considered and we believe is appropriately covered by
the allowance for loan losses.
Under both our proprietary modification programs and the
MHA programs, customers may be required to provide
updated documentation, and some programs require
completion of trial payment periods to demonstrate sustained
performance, before the loan can be removed from nonaccrual
status. In addition, for loans in foreclosure, many states,
including California, Florida and New Jersey, have enacted
legislation that significantly increases the time frames to
complete the foreclosure process, meaning that loans will
remain in nonaccrual status for longer periods.
If interest due on all nonaccrual loans (including loans that
were, but are no longer on nonaccrual at year end) had been
accrued under the original terms, approximately $1.1 billion of
interest would have been recorded as income on these loans,
compared with $344 million actually recorded as interest
income in 2011 versus $1.3 billion and $362 million,
respectively, in 2010.
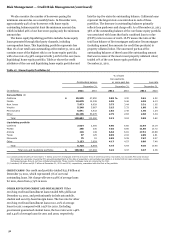
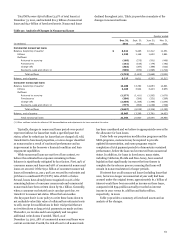
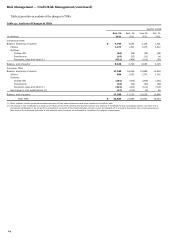
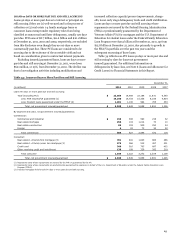
Table 31 provides a summary of foreclosed assets and an
analysis of the changes.
61