Wells Fargo 2011 Annual Report Download - page 234
Download and view the complete annual report
Please find page 234 of the 2011 Wells Fargo annual report below. You can navigate through the pages in the report by either clicking on the pages listed below, or by using the keyword search tool below to find specific information within the annual report.-
 1
1 -
2
-
3
-
4
-
5
-
6
-
7
-
8
-
9
-
10
-
11
-
12
-
13
-
14
-
15
-
16
-
17
-
18
-
19
-
20
-
21
-
22
-
23
-
24
-
25
-
26
-
27
-
28
-
29
-
30
-
31
-
32
-
33
-
34
-
35
-
36
-
37
-
38
-
39
-
40
-
41
-
42
-
43
-
44
-
45
-
46
-
47
-
48
-
49
-
50
-
51
-
52
-
53
-
54
-
55
-
56
-
57
-
58
-
59
-
60
-
61
-
62
-
63
-
64
-
65
-
66
-
67
-
68
-
69
-
70
-
71
-
72
-
73
-
74
-
75
-
76
-
77
-
78
-
79
-
80
-
81
-
82
-
83
-
84
-
85
-
86
-
87
-
88
-
89
-
90
-
91
-
92
-
93
-
94
-
95
-
96
-
97
-
98
-
99
-
100
-
101
-
102
-
103
-
104
-
105
-
106
-
107
-
108
-
109
-
110
-
111
-
112
-
113
-
114
-
115
-
116
-
117
-
118
-
119
-
120
-
121
-
122
-
123
-
124
-
125
-
126
-
127
-
128
-
129
-
130
-
131
-
132
-
133
-
134
-
135
-
136
-
137
-
138
-
139
-
140
-
141
-
142
-
143
-
144
-
145
-
146
-
147
-
148
-
149
-
150
-
151
-
152
-
153
-
154
-
155
-
156
-
157
-
158
-
159
-
160
-
161
-
162
-
163
-
164
-
165
-
166
-
167
-
168
-
169
-
170
-
171
-
172
-
173
-
174
-
175
-
176
-
177
-
178
-
179
-
180
-
181
-
182
-
183
-
184
-
185
-
186
-
187
-
188
-
189
-
190
-
191
-
192
-
193
-
194
-
195
-
196
-
197
-
198
-
199
-
200
-
201
-
202
-
203
-
204
-
205
-
206
-
207
-
208
-
209
-
210
-
211
-
212
-
213
-
214
-
215
-
216
-
217
-
218
-
219
-
220
-
221
-
222
-
223
-
 224
224 -
 225
225 -
 226
226 -
 227
227 -
 228
228 -
 229
229 -
 230
230 -
 231
231 -
 232
232 -
 233
233 -
 234
234 -
 235
235 -
 236
236 -
 237
237 -
 238
238 -
 239
239 -
 240
240
 |
 |

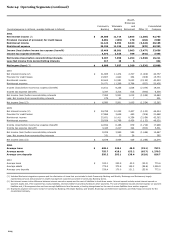
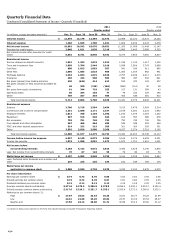
Quarterly Financial Data
Condensed Consolidated Statement of Income - Quarterly (Unaudited)
2011
2010
Quarter ended
Quarter ended
(in millions, except per share amounts)
Dec. 31
Sept. 30
June 30
Mar. 31
Dec. 31
Sept. 30
June 30
Mar. 31
Interest income
$
12,378
12,178
12,384
12,472
12,969
13,130
13,472
13,225
Interest expense
1,486
1,636
1,706
1,821
1,906
2,032
2,023
2,078
Net interest income
10,892
10,542
10,678
10,651
11,063
11,098
11,449
11,147
Provision for credit losses
2,040
1,811
1,838
2,210
2,989
3,445
3,989
5,330
Net interest income after provision for credit
losses
8,852
8,731
8,840
8,441
8,074
7,653
7,460
5,817
Noninterest income
Service charges on deposit accounts
1,091
1,103
1,074
1,012
1,035
1,132
1,417
1,332
Trust and investment fees
2,658
2,786
2,944
2,916
2,958
2,564
2,743
2,669
Card fees
680
1,013
1,003
957
941
935
911
865
Other fees
1,096
1,085
1,023
989
1,063
1,004
982
941
Mortgage banking
2,364
1,833
1,619
2,016
2,757
2,499
2,011
2,470
Insurance
466
423
568
503
564
397
544
621
Net gains (losses) from trading activities
430
(442)
414
612
532
470
109
537
Net gains (losses) on debt securities available for
sale
48
300
(128)
(166)
(268)
(114)
30
28
Net gains from equity investments
61
344
724
353
317
131
288
43
Operating leases
60
284
103
77
79
222
329
185
Other
759
357
364
409
453
536
581
610
Total noninterest income
9,713
9,086
9,708
9,678
10,431
9,776
9,945
10,301
Noninterest expense
Salaries
3,706
3,718
3,584
3,454
3,513
3,478
3,564
3,314
Commission and incentive compensation
2,251
2,088
2,171
2,347
2,195
2,280
2,225
1,992
Employee benefits
1,012
780
1,164
1,392
1,192
1,074
1,063
1,322
Equipment
607
516
528
632
813
557
588
678
Net occupancy
759
751
749
752
750
742
742
796
Core deposit and other intangibles
467
466
464
483
549
548
553
549
FDIC and other deposit assessments
314
332
315
305
301
300
295
301
Other
3,392
3,026
3,500
3,368
4,027
3,274
3,716
3,165
Total noninterest expense
12,508
11,677
12,475
12,733
13,340
12,253
12,746
12,117
Income before income tax expense
6,057
6,140
6,073
5,386
5,165
5,176
4,659
4,001
Income tax expense
1,874
1,998
2,001
1,572
1,672
1,751
1,514
1,401
Net income before
noncontrolling interests
4,183
4,142
4,072
3,814
3,493
3,425
3,145
2,600
Less: Net income from noncontrolling interests
76
87
124
55
79
86
83
53
Wells Fargo net income
$
4,107
4,055
3,948
3,759
3,414
3,339
3,062
2,547
Less: Preferred stock dividends and accretion and
other
219
216
220
189
182
189
184
175
Wells Fargo net income
applicable to common stock
$
3,888
3,839
3,728
3,570
3,232
3,150
2,878
2,372
Per share information
Earnings per common share
$
0.74
0.73
0.70
0.68
0.62
0.60
0.55
0.46
Diluted earnings per common share
0.73
0.72
0.70
0.67
0.61
0.60
0.55
0.45
Dividends declared per common share
0.12
0.12
0.12
0.12
0.05
0.05
0.05
0.05
Average common shares outstanding
5,271.9
5,275.5
5,286.5
5,278.8
5,256.2
5,240.1
5,219.7
5,190.4
Diluted average common shares outstanding
5,317.6
5,319.2
5,331.7
5,333.1
5,293.8
5,273.2
5,260.8
5,225.2
Market price per common share (1):
High
$
27.97
29.63
32.63
34.25
31.61
28.77
34.25
31.99
Low
22.61
22.58
25.26
29.82
23.37
23.02
25.52
26.37
Quarter-end
27.56
24.12
28.06
31.71
30.99
25.12
25.60
31.12
(1)
Based on daily prices reported on the New York Stock Exchange Composite Transaction Reporting System.
232