Wells Fargo 2011 Annual Report Download - page 192
Download and view the complete annual report
Please find page 192 of the 2011 Wells Fargo annual report below. You can navigate through the pages in the report by either clicking on the pages listed below, or by using the keyword search tool below to find specific information within the annual report.-
 1
1 -
2
-
3
-
4
-
5
-
6
-
7
-
8
-
9
-
10
-
11
-
12
-
13
-
14
-
15
-
16
-
17
-
18
-
19
-
20
-
21
-
22
-
23
-
24
-
25
-
26
-
27
-
28
-
29
-
30
-
31
-
32
-
33
-
34
-
35
-
36
-
37
-
38
-
39
-
40
-
41
-
42
-
43
-
44
-
45
-
46
-
47
-
48
-
49
-
50
-
51
-
52
-
53
-
54
-
55
-
56
-
57
-
58
-
59
-
60
-
61
-
62
-
63
-
64
-
65
-
66
-
67
-
68
-
69
-
70
-
71
-
72
-
73
-
74
-
75
-
76
-
77
-
78
-
79
-
80
-
81
-
82
-
83
-
84
-
85
-
86
-
87
-
88
-
89
-
90
-
91
-
92
-
93
-
94
-
95
-
96
-
97
-
98
-
99
-
100
-
101
-
102
-
103
-
104
-
105
-
106
-
107
-
108
-
109
-
110
-
111
-
112
-
113
-
114
-
115
-
116
-
117
-
118
-
119
-
120
-
121
-
122
-
123
-
124
-
125
-
126
-
127
-
128
-
129
-
130
-
131
-
132
-
133
-
134
-
135
-
136
-
137
-
138
-
139
-
140
-
141
-
142
-
143
-
144
-
145
-
146
-
147
-
148
-
149
-
150
-
151
-
152
-
153
-
154
-
155
-
156
-
157
-
158
-
159
-
160
-
161
-
162
-
163
-
164
-
165
-
166
-
167
-
168
-
169
-
170
-
171
-
172
-
173
-
174
-
175
-
176
-
177
-
178
-
179
-
180
-
181
-
 182
182 -
 183
183 -
 184
184 -
 185
185 -
 186
186 -
 187
187 -
 188
188 -
 189
189 -
 190
190 -
 191
191 -
 192
192 -
 193
193 -
 194
194 -
 195
195 -
 196
196 -
 197
197 -
 198
198 -
 199
199 -
 200
200 -
 201
201 -
 202
202 -
203
-
204
-
205
-
206
-
207
-
208
-
209
-
210
-
211
-
212
-
213
-
214
-
215
-
216
-
217
-
218
-
219
-
220
-
221
-
222
-
223
-
224
-
225
-
226
-
227
-
228
-
229
-
230
-
231
-
232
-
233
-
234
-
235
-
236
-
237
-
238
-
239
-
240
 |
 |

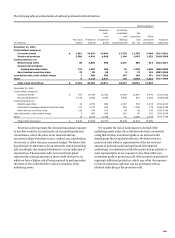
Note 16: Derivatives (continued)
Credit-Risk Contingent Features
Certain of our derivative contracts contain provisions whereby if
the credit rating of our debt, based on certain major credit rating
agencies indicated in the relevant contracts, were to fall below
investment grade, the counterparty could demand additional
collateral or require termination or replacement of derivative
instruments in a net liability position. The aggregate fair value of
all derivative instruments with such credit-risk-related
contingent features that are in a net liability position was
$17.1 billion and $12.6 billion at December 31, 2011 and 2010,
respectively, for which we had posted $15.0 billion and
$12.0 billion, respectively, in collateral in the normal course of
business. If the credit-risk-related contingent features
underlying these agreements had been triggered on December
31, 2011 or 2010, we would have been required to post additional
collateral of $2.1 billion, or $1.0 billion, respectively, or
potentially settle the contract in an amount equal to its fair
value.
Counterparty Credit Risk
By using derivatives, we are exposed to counterparty credit risk
if counterparties to the derivative contracts do not perform as
expected. If a counterparty fails to perform, our counterparty
credit risk is equal to the amount reported as a derivative asset
on our balance sheet. The amounts reported as a derivative asset
are derivative contracts in a gain position, and to the extent
subject to master netting arrangements, net of derivatives in a
loss position with the same counterparty and cash collateral
received. We minimize counterparty credit risk through credit
approvals, limits, monitoring procedures, executing master
netting arrangements and obtaining collateral, where
appropriate. To the extent the master netting arrangements and
other criteria meet the applicable requirements, derivatives
balances and related cash collateral amounts are shown net in
the balance sheet. Counterparty credit risk related to derivatives
is considered in determining fair value and our assessment of
hedge effectiveness.
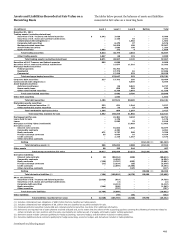
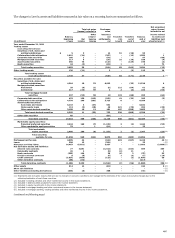
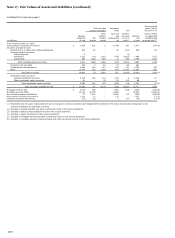
Note 17: Fair Values of Assets and Liabilities
We use fair value measurements to record fair value adjustments
to certain assets and liabilities and to determine fair value
disclosures. Trading assets, securities available for sale,
derivatives, substantially all prime residential MHFS, certain
commercial LHFS, certain loans held for investment, fair value
MSRs, principal investments and securities sold but not yet
purchased (short sale liabilities) are recorded at fair value on a
recurring basis. We generally do not record our issued debt at
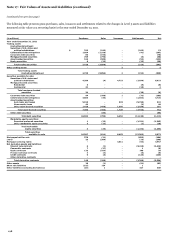
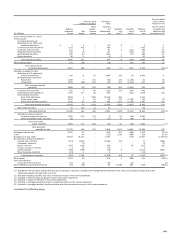
fair value. Additionally, from time to time, we may be required to
record at fair value other assets on a nonrecurring basis, such as
certain residential and commercial MHFS, certain LHFS, loans
held for investment and certain other assets. These nonrecurring
fair value adjustments typically involve application of lower-of-
cost-or-market accounting or write-downs of individual assets.
We adopted new guidance on fair value measurements
effective January 1, 2009, which addresses measuring fair value
in situations where markets are inactive and transactions are not
orderly. This guidance states transaction or quoted prices for
assets or liabilities in inactive markets may require adjustment
due to the uncertainty of whether the underlying transactions
are orderly. Prior to our adoption of the new provisions for
measuring fair value, we primarily used unadjusted independent
vendor or broker quoted prices to measure fair value for
substantially all securities available for sale.
In connection with the change in guidance for fair value
measurement, we developed policies and procedures to
determine when the level and volume of activity for our assets
and liabilities requiring fair value measurements has
significantly declined relative to normal conditions. For such
items that use price quotes, such as certain security classes
within securities available for sale, the degree of market
inactivity and distressed transactions was analyzed to determine
the appropriate adjustment to the price quotes.
The security classes where we consider the market to be less
orderly include primarily non-agency residential MBS. The
methodology used to adjust the quotes involved weighting the
price quotes and results of internal pricing techniques such as
the net present value of future expected cash flows (with
observable inputs, where available) discounted at a rate of return
market participants require. The significant inputs utilized in the
internal pricing techniques, which were estimated by type of
underlying collateral, included credit loss assumptions,
estimated prepayment speeds and appropriate discount rates.
The more active and orderly markets for particular security
classes were determined to be, the more weighting we assigned
to price quotes. The less active and orderly markets were
determined to be, the less weighting we assigned to price quotes.
We continually assess the level and volume of market activity in
our investment security classes in determining adjustments, if
any, to price quotes. Given market conditions can change over
time, determination of which securities markets are considered
active or inactive, and if inactive, the degree to which price
quotes require adjustment, can also change.
Fair Value Hierarchy
We group our assets and liabilities measured at fair value in
three levels, based on the markets in which the assets and
liabilities are traded and the reliability of the assumptions used
to determine fair value. These levels are:
Level 1 – Valuation is based upon quoted prices for identical
instruments traded in active markets.
Level 2 – Valuation is based upon quoted prices for similar
instruments in active markets, quoted prices for identical or
similar instruments in markets that are not active, and
model-based valuation techniques for which all significant
assumptions are observable in the market.
Level 3 – Valuation is generated from model-based
techniques that use significant assumptions not observable
in the market. These unobservable assumptions reflect
estimates of assumptions that market participants would
use in pricing the asset or liability. Valuation techniques
190