Wells Fargo 2011 Annual Report Download - page 187
Download and view the complete annual report
Please find page 187 of the 2011 Wells Fargo annual report below. You can navigate through the pages in the report by either clicking on the pages listed below, or by using the keyword search tool below to find specific information within the annual report.-
 1
1 -
2
-
3
-
4
-
5
-
6
-
7
-
8
-
9
-
10
-
11
-
12
-
13
-
14
-
15
-
16
-
17
-
18
-
19
-
20
-
21
-
22
-
23
-
24
-
25
-
26
-
27
-
28
-
29
-
30
-
31
-
32
-
33
-
34
-
35
-
36
-
37
-
38
-
39
-
40
-
41
-
42
-
43
-
44
-
45
-
46
-
47
-
48
-
49
-
50
-
51
-
52
-
53
-
54
-
55
-
56
-
57
-
58
-
59
-
60
-
61
-
62
-
63
-
64
-
65
-
66
-
67
-
68
-
69
-
70
-
71
-
72
-
73
-
74
-
75
-
76
-
77
-
78
-
79
-
80
-
81
-
82
-
83
-
84
-
85
-
86
-
87
-
88
-
89
-
90
-
91
-
92
-
93
-
94
-
95
-
96
-
97
-
98
-
99
-
100
-
101
-
102
-
103
-
104
-
105
-
106
-
107
-
108
-
109
-
110
-
111
-
112
-
113
-
114
-
115
-
116
-
117
-
118
-
119
-
120
-
121
-
122
-
123
-
124
-
125
-
126
-
127
-
128
-
129
-
130
-
131
-
132
-
133
-
134
-
135
-
136
-
137
-
138
-
139
-
140
-
141
-
142
-
143
-
144
-
145
-
146
-
147
-
148
-
149
-
150
-
151
-
152
-
153
-
154
-
155
-
156
-
157
-
158
-
159
-
160
-
161
-
162
-
163
-
164
-
165
-
166
-
167
-
168
-
169
-
170
-
171
-
172
-
173
-
174
-
175
-
176
-
 177
177 -
 178
178 -
 179
179 -
 180
180 -
 181
181 -
 182
182 -
 183
183 -
 184
184 -
 185
185 -
 186
186 -
 187
187 -
 188
188 -
 189
189 -
 190
190 -
 191
191 -
 192
192 -
 193
193 -
 194
194 -
 195
195 -
 196
196 -
 197
197 -
198
-
199
-
200
-
201
-
202
-
203
-
204
-
205
-
206
-
207
-
208
-
209
-
210
-
211
-
212
-
213
-
214
-
215
-
216
-
217
-
218
-
219
-
220
-
221
-
222
-
223
-
224
-
225
-
226
-
227
-
228
-
229
-
230
-
231
-
232
-
233
-
234
-
235
-
236
-
237
-
238
-
239
-
240
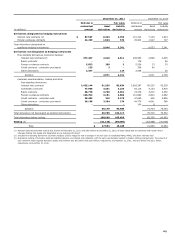
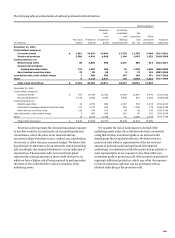
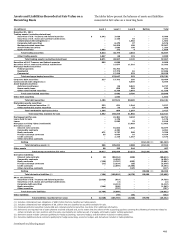
 |
 |

December 31, 2011
December 31, 2010
Notional or
Fair value
Notional or
Fair value
contractual
Asset
Liability
contractual
Asset
Liability
(in millions)
amount
derivatives
derivatives
amount
derivatives
derivatives
Derivatives designated as hedging instruments
Interest rate contracts (1)
$
87,537
8,423
2,769
110,314
7,126
1,614
Foreign exchange contracts
22,269
1,523
572
25,904
1,527
727
Total derivatives designated as
qualifying hedging instruments
9,946
3,341
8,653
2,341
Derivatives not designated as hedging instruments
Free-standing derivatives (economic hedges):
Interest rate contracts (2)
377,497
2,318
2,011
408,563
2,898
2,625
Equity contracts
-
-
-
176
-
46
Foreign exchange contracts
5,833
250
3
5,528
23
53
Credit contracts - protection purchased
125
3
-
396
80
-
Other derivatives
2,367
-
117
2,538
-
35
Subtotal
2,571
2,131
3,001
2,759
Customer accommodation, trading and other
free-standing derivatives:
Interest rate contracts
2,425,144
81,336
83,834
2,809,387
58,225
59,329
Commodity contracts
77,985
4,351
4,234
83,114
4,133
3,918
Equity contracts
68,778
3,768
3,661
73,278
3,272
3,450
Foreign exchange contracts
140,704
3,151
2,803
110,889
2,800
2,682
Credit contracts - protection sold
38,403
319
5,178
47,699
605
5,826
Credit contracts - protection purchased
36,156
3,254
276
44,776
4,661
588
Other derivatives
-
-
-
190
8
-
Subtotal
96,179
99,986
73,704
75,793
Total derivatives not designated as hedging instruments
98,750
102,117
76,705
78,552
Total derivatives before netting
108,696
105,458
85,358
80,893
Netting (3)
(81,143)
(89,990)
(63,469)
(70,009)
Total
$
27,553
15,468
21,889
10,884
(1) Notional amounts presented exclude $15.5 billion at December 31, 2011, and $20.9 billion at December 31, 2010, of basis swaps that are combined with receive fixed-
rate/pay floating-rate swaps and designated as one hedging instrument.
(2) Includes free-standing derivatives (economic hedges) used to hedge the risk of changes in the fair value of residential MSRs, MHFS, and other interests held.
(3) Represents netting of derivative asset and liability balances, and related cash collateral, with the same counterparty subject to master netting arrangements. The amount of
cash collateral netted against derivative assets and liabilities was $6.6 billion and $15.4 billion, respectively, at December 31, 2011, and $5.5 billion and $12.1 billion,
respectively, at December 31, 2010.
185