Wells Fargo 2011 Annual Report Download - page 230
Download and view the complete annual report
Please find page 230 of the 2011 Wells Fargo annual report below. You can navigate through the pages in the report by either clicking on the pages listed below, or by using the keyword search tool below to find specific information within the annual report.-
 1
1 -
2
-
3
-
4
-
5
-
6
-
7
-
8
-
9
-
10
-
11
-
12
-
13
-
14
-
15
-
16
-
17
-
18
-
19
-
20
-
21
-
22
-
23
-
24
-
25
-
26
-
27
-
28
-
29
-
30
-
31
-
32
-
33
-
34
-
35
-
36
-
37
-
38
-
39
-
40
-
41
-
42
-
43
-
44
-
45
-
46
-
47
-
48
-
49
-
50
-
51
-
52
-
53
-
54
-
55
-
56
-
57
-
58
-
59
-
60
-
61
-
62
-
63
-
64
-
65
-
66
-
67
-
68
-
69
-
70
-
71
-
72
-
73
-
74
-
75
-
76
-
77
-
78
-
79
-
80
-
81
-
82
-
83
-
84
-
85
-
86
-
87
-
88
-
89
-
90
-
91
-
92
-
93
-
94
-
95
-
96
-
97
-
98
-
99
-
100
-
101
-
102
-
103
-
104
-
105
-
106
-
107
-
108
-
109
-
110
-
111
-
112
-
113
-
114
-
115
-
116
-
117
-
118
-
119
-
120
-
121
-
122
-
123
-
124
-
125
-
126
-
127
-
128
-
129
-
130
-
131
-
132
-
133
-
134
-
135
-
136
-
137
-
138
-
139
-
140
-
141
-
142
-
143
-
144
-
145
-
146
-
147
-
148
-
149
-
150
-
151
-
152
-
153
-
154
-
155
-
156
-
157
-
158
-
159
-
160
-
161
-
162
-
163
-
164
-
165
-
166
-
167
-
168
-
169
-
170
-
171
-
172
-
173
-
174
-
175
-
176
-
177
-
178
-
179
-
180
-
181
-
182
-
183
-
184
-
185
-
186
-
187
-
188
-
189
-
190
-
191
-
192
-
193
-
194
-
195
-
196
-
197
-
198
-
199
-
200
-
201
-
202
-
203
-
204
-
205
-
206
-
207
-
208
-
209
-
210
-
211
-
212
-
213
-
214
-
215
-
216
-
217
-
218
-
219
-
 220
220 -
 221
221 -
 222
222 -
 223
223 -
 224
224 -
 225
225 -
 226
226 -
 227
227 -
 228
228 -
 229
229 -
 230
230 -
 231
231 -
 232
232 -
 233
233 -
 234
234 -
 235
235 -
 236
236 -
 237
237 -
 238
238 -
 239
239 -
 240
240
 |
 |

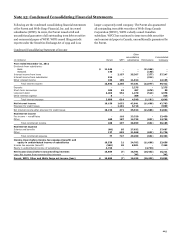
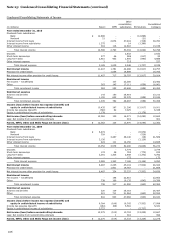
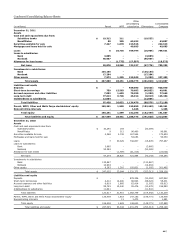
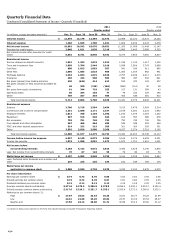
Note 25: Condensed Consolidating Financial Statements (continued)
Condensed Consolidating Statements of Cash Flows
Year ended December 31,
2011
2010
Other
Other
consolidating
consolidating
subsidiaries/
Consolidated
subsidiaries/
Consolidated
(in millions)
Parent
WFFI
eliminations
Company
Parent
WFFI
eliminations
Company
Cash flows from operating activities:
Net cash provided (used)
by operating activities
$
15,049
1,563
(2,947)
13,665
14,180
1,774
2,818
18,772
Cash flows from investing activities:
Securities available for sale:
Sales proceeds
11,459
1,946
9,657
23,062
2,441
796
5,431
8,668
Prepayments and maturities
-
294
52,324
52,618
-
229
47,690
47,919
Purchases
(16,487)
(1,086)
(103,662)
(121,235)
(119)
(1,037)
(52,310)
(53,466)
Loans:
Loans originated by banking
subsidiaries, net of principal
collected
-
(596)
(35,090)
(35,686)
-
(206)
16,075
15,869
Proceeds from sales (including
participations) of loans
originated for investment by
banking subsidiaries
-
-
6,555
6,555
-
-
6,517
6,517
Purchases (including participations)
of loans by banking
subsidiaries
-
-
(8,878)
(8,878)
-
-
(2,297)
(2,297)
Principal collected on nonbank
entities' loans
-
9,984
(202)
9,782
-
10,829
4,731
15,560
Loans originated by nonbank entities
-
(7,520)
(2)
(7,522)
-
(6,336)
(4,500)
(10,836)
Net repayments from
(advances to) subsidiaries
1,318
(81)
(1,237)
-
(5,485)
(842)
6,327
-
Capital notes and term loans
made to subsidiaries
(1,340)
-
1,340
-
-
-
-
-
Principal collected on notes/loans
made to subsidiaries
5,779
-
(5,779)
-
11,282
-
(11,282)
-
Net decrease (increase) in
investment in subsidiaries
(610)
-
610
-
1,198
-
(1,198)
-
Net cash paid for acquisitions
-
-
(353)
(353)
-
-
(36)
(36)
Other, net
230
210
46,173
46,613
15
64
(31,652)
(31,573)
Net cash provided (used)
by investing activities
349
3,151
(38,544)
(35,044)
9,332
3,497
(16,504)
(3,675)
Cash flows from financing activities:
Net change in:
Deposits
-
-
72,128
72,128
-
-
23,924
23,924
Short-term borrowings
(242)
1,013
(7,002)
(6,231)
1,860
4,118
5,330
11,308
Long-term debt:
Proceeds from issuance
7,058
513
4,116
11,687
1,789
-
1,700
3,489
Repayment
(31,198)
(6,029)
(13,328)
(50,555)
(23,281)
(9,478)
(30,558)
(63,317)
Preferred stock:
Proceeds from issuance
2,501
-
-
2,501
-
-
-
-
Cash dividends paid
(844)
-
-
(844)
(737)
-
-
(737)
Common stock warrants repurchased
(2)
-
-
(2)
(545)
-
-
(545)
Common stock:
Proceeds from issuance
1,296
-
-
1,296
1,375
-
-
1,375
Repurchased
(2,416)
-
-
(2,416)
(91)
-
-
(91)
Cash dividends paid
(2,537)
-
-
(2,537)
(1,045)
-
-
(1,045)
Excess tax benefits related to
stock option payments
79
-
-
79
98
-
-
98
Net change in noncontrolling interests:
Other
-
(11)
(320)
(331)
-
1
(593)
(592)
Net cash provided (used) by
financing activities
(26,305)
(4,514)
55,594
24,775
(20,577)
(5,359)
(197)
(26,133)
Net change in cash and
due from banks
(10,907)
200
14,103
3,396
2,935
(88)
(13,883)
(11,036)
Cash and due from banks
at beginning of year
30,249
366
(14,571)
16,044
27,314
454
(688)
27,080
Cash and due from banks
at end of year
$
19,342
566
(468)
19,440
30,249
366
(14,571)
16,044
228