Wells Fargo 2011 Annual Report Download - page 216
Download and view the complete annual report
Please find page 216 of the 2011 Wells Fargo annual report below. You can navigate through the pages in the report by either clicking on the pages listed below, or by using the keyword search tool below to find specific information within the annual report.-
 1
1 -
2
-
3
-
4
-
5
-
6
-
7
-
8
-
9
-
10
-
11
-
12
-
13
-
14
-
15
-
16
-
17
-
18
-
19
-
20
-
21
-
22
-
23
-
24
-
25
-
26
-
27
-
28
-
29
-
30
-
31
-
32
-
33
-
34
-
35
-
36
-
37
-
38
-
39
-
40
-
41
-
42
-
43
-
44
-
45
-
46
-
47
-
48
-
49
-
50
-
51
-
52
-
53
-
54
-
55
-
56
-
57
-
58
-
59
-
60
-
61
-
62
-
63
-
64
-
65
-
66
-
67
-
68
-
69
-
70
-
71
-
72
-
73
-
74
-
75
-
76
-
77
-
78
-
79
-
80
-
81
-
82
-
83
-
84
-
85
-
86
-
87
-
88
-
89
-
90
-
91
-
92
-
93
-
94
-
95
-
96
-
97
-
98
-
99
-
100
-
101
-
102
-
103
-
104
-
105
-
106
-
107
-
108
-
109
-
110
-
111
-
112
-
113
-
114
-
115
-
116
-
117
-
118
-
119
-
120
-
121
-
122
-
123
-
124
-
125
-
126
-
127
-
128
-
129
-
130
-
131
-
132
-
133
-
134
-
135
-
136
-
137
-
138
-
139
-
140
-
141
-
142
-
143
-
144
-
145
-
146
-
147
-
148
-
149
-
150
-
151
-
152
-
153
-
154
-
155
-
156
-
157
-
158
-
159
-
160
-
161
-
162
-
163
-
164
-
165
-
166
-
167
-
168
-
169
-
170
-
171
-
172
-
173
-
174
-
175
-
176
-
177
-
178
-
179
-
180
-
181
-
182
-
183
-
184
-
185
-
186
-
187
-
188
-
189
-
190
-
191
-
192
-
193
-
194
-
195
-
196
-
197
-
198
-
199
-
200
-
201
-
202
-
203
-
204
-
205
-
 206
206 -
 207
207 -
 208
208 -
 209
209 -
 210
210 -
 211
211 -
 212
212 -
 213
213 -
 214
214 -
 215
215 -
 216
216 -
 217
217 -
 218
218 -
 219
219 -
 220
220 -
 221
221 -
 222
222 -
 223
223 -
 224
224 -
 225
225 -
 226
226 -
227
-
228
-
229
-
230
-
231
-
232
-
233
-
234
-
235
-
236
-
237
-
238
-
239
-
240
 |
 |

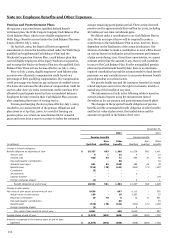
Note 20: Employee Benefits and Other Expenses (continued)
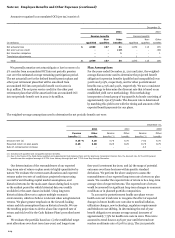
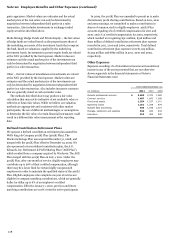
Amounts recognized in accumulated OCI (pre tax) consist of:
December 31,
2011
2010
Pension benefits
Pension benefits
Non-
Other
Non-
Other
(in millions)
Qualified
qualified
benefits
Qualified
qualified
benefits
Net actuarial loss
$
2,699
137
61
1,672
113
135
Net prior service credit
-
-
(27)
-
-
(30)
Net transition obligation
-
-
1
-
-
1
Translation adjustments
-
-
-
1
-
-
Total
$
2,699
137
35
1,673
113
106
We generally amortize net actuarial gain or loss in excess of a
5% corridor from accumulated OCI into net periodic pension
cost over the estimated average remaining participation period.
The net actuarial loss for the defined benefit pension plans and
other post retirement plans that will be amortized from
accumulated OCI into net periodic benefit cost in 2012 is
$141 million. The net prior service credit for the other post
retirement plans that will be amortized from accumulated OCI
into net periodic benefit cost in 2012 is $2 million.
Plan Assumptions
For the years ended December 31, 2011 and 2010, the weighted-
average discount rate used to determine the projected benefit
obligation for pension benefits (qualified and nonqualified) was
5.00% and 5.25%, respectively, and for other postretirement
benefits was 4.75% and 5.25%, respectively. We use a consistent
methodology to determine the discount rate that is based on an
established yield curve methodology. This methodology
incorporates a broad group of top quartile Aa bonds consisting of
approximately 250-275 bonds. The discount rate is determined
by matching this yield curve with the timing and amounts of the
expected benefit payments for our plans.
The weighted-average assumptions used to determine the net periodic benefit cost were:
December 31,
2011
2010
2009
Pension
Other
Pension
Other
Pension
Other
benefits (1)
benefits
benefits (1)
benefits
benefits (1)
benefits
Discount rate (2)
5.25
%
5.25
5.75
5.75
7.42
6.75
Expected return on plan assets
8.25
6.00
8.25
8.25
8.75
8.75
Rate of compensation increase
-
-
-
-
4.0
-
(1) Includes both qualified and nonqualified pension benefits.
(2) Due to the freeze of the Wells Fargo qualified and supplemental Cash Balance Plans and the Wachovia Corporation Pension Plan, the discount rate for the 2009 pension
benefits was the weighted average of 6.75% from January through April and 7.75% from May through December.
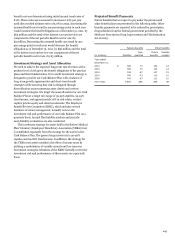
Our determination of the reasonableness of our expected
long-term rate of return on plan assets is highly quantitative by
nature. We evaluate the current asset allocations and expected
returns under two sets of conditions: projected returns using
several forward-looking capital market assumptions, and
historical returns for the main asset classes dating back to 1970
or the earliest period for which historical data was readily
available for the asset classes included. Using long term
historical data allows us to capture multiple economic
environments, which we believe is relevant when using historical
returns. We place greater emphasis on the forward-looking
return and risk assumptions than on historical results. We use
the resulting projections to derive a base line expected rate of
return and risk level for the Cash Balance Plans' prescribed asset
mix.
We evaluate the portfolio based on: (1) the established target
asset allocations over short term (one-year) and longer term
(ten-year) investment horizons, and (2) the range of potential
outcomes over these horizons within specific standard
deviations. We perform the above analyses to assess the
reasonableness of our expected long-term rate of return on plan
assets. We consider the expected rate of return to be a long-term
average view of expected returns. The expected rate of return
would be assessed for significant long-term changes in economic
conditions or in planned portfolio composition.
To account for postretirement health care plans we use
health care cost trend rates to recognize the effect of expected
changes in future health care costs due to medical inflation,
utilization changes, new technology, regulatory requirements
and Medicare cost shifting. In determining the end of year
benefit obligation we assume average annual increases of
approximately 7.75% for health care costs in 2012. This rate is
assumed to trend down 0.25% per year until the trend rate
reaches an ultimate rate of 5.0% in 2023. The 2011 periodic
214