Wells Fargo 2011 Annual Report Download - page 211
Download and view the complete annual report
Please find page 211 of the 2011 Wells Fargo annual report below. You can navigate through the pages in the report by either clicking on the pages listed below, or by using the keyword search tool below to find specific information within the annual report.-
 1
1 -
2
-
3
-
4
-
5
-
6
-
7
-
8
-
9
-
10
-
11
-
12
-
13
-
14
-
15
-
16
-
17
-
18
-
19
-
20
-
21
-
22
-
23
-
24
-
25
-
26
-
27
-
28
-
29
-
30
-
31
-
32
-
33
-
34
-
35
-
36
-
37
-
38
-
39
-
40
-
41
-
42
-
43
-
44
-
45
-
46
-
47
-
48
-
49
-
50
-
51
-
52
-
53
-
54
-
55
-
56
-
57
-
58
-
59
-
60
-
61
-
62
-
63
-
64
-
65
-
66
-
67
-
68
-
69
-
70
-
71
-
72
-
73
-
74
-
75
-
76
-
77
-
78
-
79
-
80
-
81
-
82
-
83
-
84
-
85
-
86
-
87
-
88
-
89
-
90
-
91
-
92
-
93
-
94
-
95
-
96
-
97
-
98
-
99
-
100
-
101
-
102
-
103
-
104
-
105
-
106
-
107
-
108
-
109
-
110
-
111
-
112
-
113
-
114
-
115
-
116
-
117
-
118
-
119
-
120
-
121
-
122
-
123
-
124
-
125
-
126
-
127
-
128
-
129
-
130
-
131
-
132
-
133
-
134
-
135
-
136
-
137
-
138
-
139
-
140
-
141
-
142
-
143
-
144
-
145
-
146
-
147
-
148
-
149
-
150
-
151
-
152
-
153
-
154
-
155
-
156
-
157
-
158
-
159
-
160
-
161
-
162
-
163
-
164
-
165
-
166
-
167
-
168
-
169
-
170
-
171
-
172
-
173
-
174
-
175
-
176
-
177
-
178
-
179
-
180
-
181
-
182
-
183
-
184
-
185
-
186
-
187
-
188
-
189
-
190
-
191
-
192
-
193
-
194
-
195
-
196
-
197
-
198
-
199
-
200
-
 201
201 -
 202
202 -
 203
203 -
 204
204 -
 205
205 -
 206
206 -
 207
207 -
 208
208 -
 209
209 -
 210
210 -
 211
211 -
 212
212 -
 213
213 -
 214
214 -
 215
215 -
 216
216 -
 217
217 -
 218
218 -
 219
219 -
 220
220 -
 221
221 -
222
-
223
-
224
-
225
-
226
-
227
-
228
-
229
-
230
-
231
-
232
-
233
-
234
-
235
-
236
-
237
-
238
-
239
-
240
 |
 |

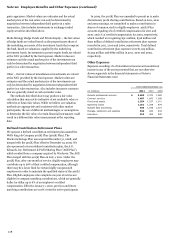
A portion of annual bonus awards recognized during 2009
that are normally paid in cash was paid in our common stock as
part of our agreement with the U.S. Treasury to repay our
participation in the TARP CPP. The fair value of the stock that
was issued was $94 million and there were no vesting conditions
or other restrictions on the stock. No annual bonus awards
recognized after 2009 were paid in common stock.
During 2009 the Board of Directors approved salary
increases for certain executive officers that were paid, after taxes
and other withholdings, in our common stock. In 2010 and
2009, respectively, 62,630 shares and 244,689 shares were
issued for salary increases at an average fair value of $27.44 and
$27.77, respectively. There are no restrictions on these shares
because we repaid the TARP CPP investment in Wells Fargo in
December 2009. No salary increases were paid in common stock
after March 2010.
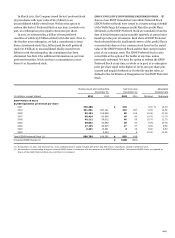
For various acquisitions and mergers, we converted employee
and director stock options of acquired or merged companies into
stock options to purchase our common stock based on the terms
of the original stock option plan and the agreed-upon exchange
ratio. In addition, we converted restricted stock awards into
awards that entitle holders to our stock after the vesting
conditions are met. Holders receive cash dividends on
outstanding awards if provided in the original award.
The total number of shares of common stock available for
grant under the plans at December 31, 2011, was 157 million.
PARTNERSHARES PLAN
In 1996, we adopted the
PartnerShares
®
Stock Option Plan, a broad-based employee
stock option plan. It covers full- and part-time employees who
generally were not included in the LTICP described above. No
options have been granted under the plan since 2002, and as a
result of action taken by the Board of Directors on
January 22, 2008, no future awards will be granted under the
plan. All of our PartnerShares Plan grants were fully vested as of
December 31, 2007.
Director Awards
Under the LTICP, we grant common stock and options to
purchase common stock to non-employee directors elected or re-
elected at the annual meeting of stockholders and prorated
awards to directors who join the Board at any other time. The
stock award vests immediately. Options granted to directors can
be exercised after twelve months through the tenth anniversary
of the grant date. Options granted prior to 2005 may include the
right to acquire a “reload” stock option.
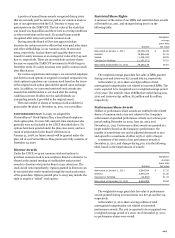
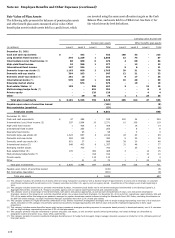
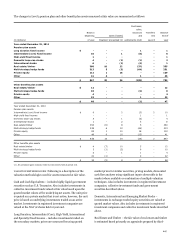
Restricted Share Rights
A summary of the status of our RSRs and restricted share awards
at December 31, 2011, and changes during 2011 is in the
following table:
Weighted-
average
grant date
Number
fair value
Nonvested at January 1, 2011
23,036,722
$
26.98
Granted
18,836,636
31.02
Vested
(1,426,158)
28.55
Canceled or forfeited
(1,167,071)
28.52
Nonvested at December 31, 2011
39,280,129
28.81
The weighted-average grant date fair value of RSRs granted
during 2010 and 2009 was $27.29 and $19.04, respectively.
At December 31, 2011, there was $561 million of total
unrecognized compensation cost related to nonvested RSRs. The
cost is expected to be recognized over a weighted-average period
of 3.6 years. The total fair value of RSRs that vested during 2011,
2010 and 2009 was $41 million, $15 million and $2 million,
respectively.
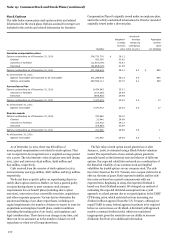
Performance Share Awards
Holders of performance share awards are entitled to the related
shares of common stock at no cost subject to the Company's
achievement of specified performance criteria over a three-year
period ending December 31, 2013, June 30, 2013, and
December 31, 2012. Performance share awards are granted at a
target number; based on the Company's performance, the
number of awards that vest can be adjusted downward to zero
and upward to a maximum of either 125% or 150% of target.
A summary of the status of our performance awards at
December 31, 2011, and changes during 2011 is in the following
table, based on the target amount of awards:
Weighted-
average
grant date
Number
fair value
Nonvested at January 1, 2011
2,564,584
$
27.32
Granted
3,853,274
31.26
Canceled or forfeited
(12,893)
31.33
Nonvested at December 31, 2011
6,404,965
29.68
The weighted-average grant date fair value of performance
awards granted during 2010 and 2009 was $27.46 and $27.09,
respectively.
At December 31, 2011, there was $45 million of total
unrecognized compensation cost related to nonvested
performance awards. The cost is expected to be recognized over
a weighted-average period of 2 years. As of December 31, 2011,
no performance shares were vested.
209