Wells Fargo 2011 Annual Report Download - page 41
Download and view the complete annual report
Please find page 41 of the 2011 Wells Fargo annual report below. You can navigate through the pages in the report by either clicking on the pages listed below, or by using the keyword search tool below to find specific information within the annual report.-
 1
1 -
2
-
3
-
4
-
5
-
6
-
7
-
8
-
9
-
10
-
11
-
12
-
13
-
14
-
15
-
16
-
17
-
18
-
19
-
20
-
21
-
22
-
23
-
24
-
25
-
26
-
27
-
28
-
29
-
30
-
 31
31 -
 32
32 -
 33
33 -
 34
34 -
 35
35 -
 36
36 -
 37
37 -
 38
38 -
 39
39 -
 40
40 -
 41
41 -
 42
42 -
 43
43 -
 44
44 -
 45
45 -
 46
46 -
 47
47 -
 48
48 -
 49
49 -
 50
50 -
 51
51 -
52
-
53
-
54
-
55
-
56
-
57
-
58
-
59
-
60
-
61
-
62
-
63
-
64
-
65
-
66
-
67
-
68
-
69
-
70
-
71
-
72
-
73
-
74
-
75
-
76
-
77
-
78
-
79
-
80
-
81
-
82
-
83
-
84
-
85
-
86
-
87
-
88
-
89
-
90
-
91
-
92
-
93
-
94
-
95
-
96
-
97
-
98
-
99
-
100
-
101
-
102
-
103
-
104
-
105
-
106
-
107
-
108
-
109
-
110
-
111
-
112
-
113
-
114
-
115
-
116
-
117
-
118
-
119
-
120
-
121
-
122
-
123
-
124
-
125
-
126
-
127
-
128
-
129
-
130
-
131
-
132
-
133
-
134
-
135
-
136
-
137
-
138
-
139
-
140
-
141
-
142
-
143
-
144
-
145
-
146
-
147
-
148
-
149
-
150
-
151
-
152
-
153
-
154
-
155
-
156
-
157
-
158
-
159
-
160
-
161
-
162
-
163
-
164
-
165
-
166
-
167
-
168
-
169
-
170
-
171
-
172
-
173
-
174
-
175
-
176
-
177
-
178
-
179
-
180
-
181
-
182
-
183
-
184
-
185
-
186
-
187
-
188
-
189
-
190
-
191
-
192
-
193
-
194
-
195
-
196
-
197
-
198
-
199
-
200
-
201
-
202
-
203
-
204
-
205
-
206
-
207
-
208
-
209
-
210
-
211
-
212
-
213
-
214
-
215
-
216
-
217
-
218
-
219
-
220
-
221
-
222
-
223
-
224
-
225
-
226
-
227
-
228
-
229
-
230
-
231
-
232
-
233
-
234
-
235
-
236
-
237
-
238
-
239
-
240
 |
 |

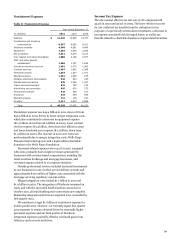
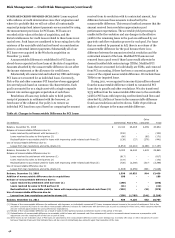
Noninterest Expense
Table 8: Noninterest Expense
Year ended December 31,
(in millions)
2011
2010
2009
Salaries
$
14,462
13,869
13,757
Commission and incentive
compensation
8,857
8,692
8,021
Employee benefits
4,348
4,651
4,689
Equipment
2,283
2,636
2,506
Net occupancy
3,011
3,030
3,127
Core deposit and other intangibles
1,880
2,199
2,577
FDIC and other deposit
assessments
1,266
1,197
1,849
Outside professional services
2,692
2,370
1,982
Contract services
1,407
1,642
1,088
Foreclosed assets
1,354
1,537
1,071
Operating losses
1,261
1,258
875
Postage, stationery and supplies
942
944
933
Outside data processing
935
1,046
1,027
Travel and entertainment
821
783
575
Advertising and promotion
607
630
572
Telecommunications
523
596
610
Insurance
515
464
845
Operating leases
112
109
227
All other
2,117
2,803
2,689
Total
$
49,393
50,456
49,020
Noninterest expense was $49.4 billion in 2011, down 2% from
$50.5 billion in 2010, driven by lower merger integration costs,
which also contributed to decreases in equipment expense
($2.3 billion, down from $2.6 billion in 2010), lower contract
services expense ($1.4 billion, down from $1.6 billion in 2010)
and lower foreclosed asset expense ($1.4 billion, down from
$1.5 billion in 2010). The increase in 2010 over 2009 was
predominantly due to merger integration costs, Wells Fargo
Financial restructuring costs and a $400 million charitable
donation to the Wells Fargo Foundation.
Personnel-related expenses were up 2% in 2011 compared
with 2010, primarily due to higher revenues generated by
businesses with revenue-based compensation, including the
retail securities brokerage and mortgage businesses, and
severance expense related to our expense initiative.
Outside professional services included increased investments
by our businesses in 2011 in their service delivery systems and
approximately $100 million of higher costs associated with the
mortgage servicing regulatory consent orders.
Merger integration costs totaled $1.7 billion in 2011 and
$1.9 billion in 2010. The integration of Wachovia remained on
track, and with the successful North Carolina conversion in
October 2011, all retail banking store conversions are complete.
Remaining integration activities are expected to be concluded by
first quarter 2012.
We continue to target $11 billion of noninterest expense for
fourth quarter 2012. However, we currently expect first quarter
2012 expenses to remain elevated driven by seasonally higher
personnel expenses and our final quarter of Wachovia
integration expenses, partially offset by continued gains from
efficiency and cost save initiatives.
Income Tax Expense
The 2011 annual effective tax rate was 31.9% compared with
33.9% in 2010 and 30.3% in 2009. The lower effective tax rate
for 2011 reflected tax benefits from the realization for tax
purposes of a previously written down investment, a decrease in
tax expense associated with leveraged leases, as well as tax
benefits related to charitable donations of appreciated securities.
39