Wells Fargo 2011 Annual Report Download - page 181
Download and view the complete annual report
Please find page 181 of the 2011 Wells Fargo annual report below. You can navigate through the pages in the report by either clicking on the pages listed below, or by using the keyword search tool below to find specific information within the annual report.-
 1
1 -
2
-
3
-
4
-
5
-
6
-
7
-
8
-
9
-
10
-
11
-
12
-
13
-
14
-
15
-
16
-
17
-
18
-
19
-
20
-
21
-
22
-
23
-
24
-
25
-
26
-
27
-
28
-
29
-
30
-
31
-
32
-
33
-
34
-
35
-
36
-
37
-
38
-
39
-
40
-
41
-
42
-
43
-
44
-
45
-
46
-
47
-
48
-
49
-
50
-
51
-
52
-
53
-
54
-
55
-
56
-
57
-
58
-
59
-
60
-
61
-
62
-
63
-
64
-
65
-
66
-
67
-
68
-
69
-
70
-
71
-
72
-
73
-
74
-
75
-
76
-
77
-
78
-
79
-
80
-
81
-
82
-
83
-
84
-
85
-
86
-
87
-
88
-
89
-
90
-
91
-
92
-
93
-
94
-
95
-
96
-
97
-
98
-
99
-
100
-
101
-
102
-
103
-
104
-
105
-
106
-
107
-
108
-
109
-
110
-
111
-
112
-
113
-
114
-
115
-
116
-
117
-
118
-
119
-
120
-
121
-
122
-
123
-
124
-
125
-
126
-
127
-
128
-
129
-
130
-
131
-
132
-
133
-
134
-
135
-
136
-
137
-
138
-
139
-
140
-
141
-
142
-
143
-
144
-
145
-
146
-
147
-
148
-
149
-
150
-
151
-
152
-
153
-
154
-
155
-
156
-
157
-
158
-
159
-
160
-
161
-
162
-
163
-
164
-
165
-
166
-
167
-
168
-
169
-
170
-
 171
171 -
 172
172 -
 173
173 -
 174
174 -
 175
175 -
 176
176 -
 177
177 -
 178
178 -
 179
179 -
 180
180 -
 181
181 -
 182
182 -
 183
183 -
 184
184 -
 185
185 -
 186
186 -
 187
187 -
 188
188 -
 189
189 -
 190
190 -
 191
191 -
192
-
193
-
194
-
195
-
196
-
197
-
198
-
199
-
200
-
201
-
202
-
203
-
204
-
205
-
206
-
207
-
208
-
209
-
210
-
211
-
212
-
213
-
214
-
215
-
216
-
217
-
218
-
219
-
220
-
221
-
222
-
223
-
224
-
225
-
226
-
227
-
228
-
229
-
230
-
231
-
232
-
233
-
234
-
235
-
236
-
237
-
238
-
239
-
240
 |
 |

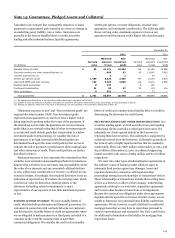
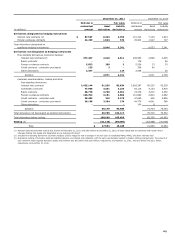
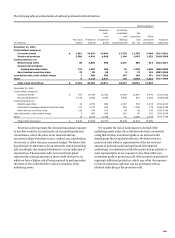
Note 14: Guarantees, Pledged Assets and Collateral
Guarantees are contracts that contingently require us to make
payments to a guaranteed party based on an event or a change in
an underlying asset, liability, rate or index. Guarantees are
generally in the form of standby letters of credit, securities
lending and other indemnifications, liquidity agreements,
written put options, recourse obligations, residual value
guarantees, and contingent consideration. The following table
shows carrying value, maximum exposure to loss on our
guarantees and the amount with a higher risk of performance.
December 31,
2011
2010
Maximum
Non-
Maximum
Non-
Carrying
exposure
investment
Carrying
exposure
investment
(in millions)
value
to loss
grade
value
to loss
grade
Standby letters of credit
$
85
41,171
22,259
142
42,159
19,596
Securities lending and other indemnifications (1)
-
669
62
45
13,645
3,993
Liquidity agreements (2)
-
2
2
-
49
1
Written put options (2)(3)
1,469
8,224
2,466
747
8,134
2,615
Loans and MHFS sold with recourse
102
5,784
3,850
119
5,474
3,564
Residual value guarantees
8
197
-
8
197
-
Contingent consideration
31
98
97
23
118
116
Other guarantees
6
552
4
-
73
-
Total guarantees
$
1,701
56,697
28,740
1,084
69,849
29,885
(1) We commenced divestiture of our securities lending business in the latter half of 2011.
(2) Certain of these agreements included in this table are related to off-balance sheet entities and, accordingly, are also disclosed in Note 8.
(3) Written put options, which are in the form of derivatives, are also included in the derivative disclosures in Note 16.
“Maximum exposure to loss” and “Non-investment grade” are
required disclosures under GAAP. Non-investment grade
represents those guarantees on which we have a higher risk of
being required to perform under the terms of the guarantee. If
the underlying assets under the guarantee are non-investment
grade (that is, an external rating that is below investment grade
or an internal credit default grade that is equivalent to a below
investment grade external rating), we consider the risk of
performance to be high. Internal credit default grades are
determined based upon the same credit policies that we use to
evaluate the risk of payment or performance when making loans
and other extensions of credit. These credit policies are further
described in Note 6.
Maximum exposure to loss represents the estimated loss that
would be incurred under an assumed hypothetical circumstance,
despite what we believe is its extremely remote possibility, where
the value of our interests and any associated collateral declines
to zero, without any consideration of recovery or offset from any
economic hedges. Accordingly, this required disclosure is not an
indication of expected loss. We believe the carrying value, which
is either fair value for derivative related products or the
allowance for lending related commitments, is more
representative of our exposure to loss than maximum exposure
to loss.
STANDBY LETTERS OF CREDIT
We issue standby letters of
credit, which include performance and financial guarantees, for
customers in connection with contracts between our customers
and third parties. Standby letters of credit are agreements where
we are obligated to make payment to a third party on behalf of a
customer in the event the customer fails to meet their
contractual obligations. We consider the credit risk in standby
letters of credit and commercial and similar letters of credit in
determining the allowance for credit losses.
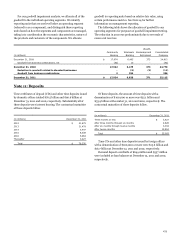
SECURITIES LENDING AND OTHER INDEMNIFICATIONS
As a
securities lending agent, we lend securities from participating
institutional clients’ portfolios to third-party borrowers. We
indemnify our clients against default by the borrower in
returning these lent securities. This indemnity is supported by
collateral received from the borrowers. Collateral is generally in
the form of cash or highly liquid securities that are marked to
market daily. There was $687 million at December 31, 2011, and
$14.0 billion at December 31, 2010, in collateral supporting
loaned securities with values of $669 million and $13.6 billion,
respectively.
We enter into other types of indemnification agreements in
the ordinary course of business under which we agree to
indemnify third parties against any damages, losses and
expenses incurred in connection with legal and other
proceedings arising from relationships or transactions with us.
These relationships or transactions include those arising from
service as a director or officer of the Company, underwriting
agreements relating to our securities, acquisition agreements
and various other business transactions or arrangements.
Because the extent of our obligations under these agreements
depends entirely upon the occurrence of future events, we are
unable to determine our potential future liability under these
agreements. We do, however, record a liability for residential
mortgage loans that we may have to repurchase pursuant to
various representations and warranties. See Note 1 and Note 9
for additional information on the liability for mortgage loan
repurchase losses.
179