Wells Fargo 2011 Annual Report Download - page 165
Download and view the complete annual report
Please find page 165 of the 2011 Wells Fargo annual report below. You can navigate through the pages in the report by either clicking on the pages listed below, or by using the keyword search tool below to find specific information within the annual report.-
 1
1 -
2
-
3
-
4
-
5
-
6
-
7
-
8
-
9
-
10
-
11
-
12
-
13
-
14
-
15
-
16
-
17
-
18
-
19
-
20
-
21
-
22
-
23
-
24
-
25
-
26
-
27
-
28
-
29
-
30
-
31
-
32
-
33
-
34
-
35
-
36
-
37
-
38
-
39
-
40
-
41
-
42
-
43
-
44
-
45
-
46
-
47
-
48
-
49
-
50
-
51
-
52
-
53
-
54
-
55
-
56
-
57
-
58
-
59
-
60
-
61
-
62
-
63
-
64
-
65
-
66
-
67
-
68
-
69
-
70
-
71
-
72
-
73
-
74
-
75
-
76
-
77
-
78
-
79
-
80
-
81
-
82
-
83
-
84
-
85
-
86
-
87
-
88
-
89
-
90
-
91
-
92
-
93
-
94
-
95
-
96
-
97
-
98
-
99
-
100
-
101
-
102
-
103
-
104
-
105
-
106
-
107
-
108
-
109
-
110
-
111
-
112
-
113
-
114
-
115
-
116
-
117
-
118
-
119
-
120
-
121
-
122
-
123
-
124
-
125
-
126
-
127
-
128
-
129
-
130
-
131
-
132
-
133
-
134
-
135
-
136
-
137
-
138
-
139
-
140
-
141
-
142
-
143
-
144
-
145
-
146
-
147
-
148
-
149
-
150
-
151
-
152
-
153
-
154
-
 155
155 -
 156
156 -
 157
157 -
 158
158 -
 159
159 -
 160
160 -
 161
161 -
 162
162 -
 163
163 -
 164
164 -
 165
165 -
 166
166 -
 167
167 -
 168
168 -
 169
169 -
 170
170 -
 171
171 -
 172
172 -
 173
173 -
 174
174 -
 175
175 -
176
-
177
-
178
-
179
-
180
-
181
-
182
-
183
-
184
-
185
-
186
-
187
-
188
-
189
-
190
-
191
-
192
-
193
-
194
-
195
-
196
-
197
-
198
-
199
-
200
-
201
-
202
-
203
-
204
-
205
-
206
-
207
-
208
-
209
-
210
-
211
-
212
-
213
-
214
-
215
-
216
-
217
-
218
-
219
-
220
-
221
-
222
-
223
-
224
-
225
-
226
-
227
-
228
-
229
-
230
-
231
-
232
-
233
-
234
-
235
-
236
-
237
-
238
-
239
-
240
 |
 |

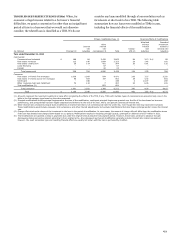
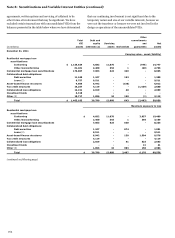
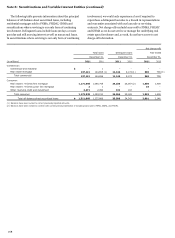
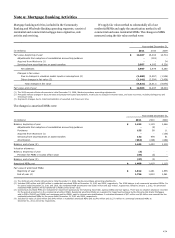
(continued from previous page)
Other
Total
Debt and
commitments
VIE
equity
Servicing
and
Net
(in millions)
assets
interests (1)
assets
Derivatives
guarantees
assets
December 31, 2010
Carrying value - asset (liability)
Residential mortgage loan securitizations:
Conforming
$
1,068,737
5,527
12,115
-
(928)
16,714
Other/nonconforming
76,304
2,997
495
6
(107)
3,391
Commercial mortgage loan securitizations
190,377
5,506
608
261
-
6,375
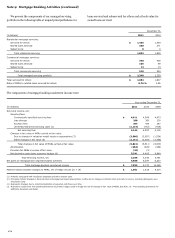
Collateralized debt obligations:
Debt securities
20,046
1,436
-
844
-
2,280
Loans (2)
9,970
9,689
-
-
-
9,689
Asset-based finance structures
12,055
6,556
-
(118)
-
6,438
Tax credit structures
20,981
3,614
-
-
(1,129)
2,485
Collateralized loan obligations
13,196
2,804
-
56
-
2,860
Investment funds
10,522
1,416
-
-
-
1,416
Other (3)
20,031
3,221
43
377
(6)
3,635
Total
$
1,442,219
42,766
13,261
1,426
(2,170)
55,283
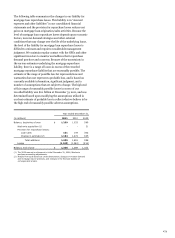
Maximum exposure to loss
Residential mortgage loan securitizations:
Conforming
$
5,527
12,115
-
4,248
21,890
Other/nonconforming
2,997
495
6
233
3,731
Commercial mortgage loan securitizations
5,506
608
488
-
6,602
Collateralized debt obligations:
Debt securities
1,436
-
2,850
7
4,293
Loans (2)
9,689
-
-
-
9,689
Asset-based finance structures
6,556
-
118
2,175
8,849
Tax credit structures
3,614
-
-
1
3,615
Collateralized loan obligations
2,804
-
56
519
3,379
Investment funds
1,416
-
-
87
1,503
Other (3)
3,221
43
916
162
4,342
Total
$
42,766
13,261
4,434
7,432
67,893
(1) Includes total equity interests of $460 million and $316 million at December 31, 2011, and December 31, 2010, respectively. Also includes debt interests in the form of both
loans and securities. Excludes certain debt securities held related to loans serviced for FNMA, FHLMC and GNMA.
(2) Represents senior loans to trusts that are collateralized by asset-backed securities. The trusts invest primarily in senior tranches from a diversified pool of primarily U.S.
asset securitizations, of which all are current, and over 88% were rated as investment grade by the primary rating agencies at December 31, 2011. These senior loans were
acquired in the Wachovia business combination and are accounted for at amortized cost as initially determined under purchase accounting and are subject to the Company’s
allowance and credit charge-off policies.
(3) Includes structured financing, student loan securitizations, auto loan and lease securitizations and credit-linked note structures. Also contains investments in auction rate
securities (ARS) issued by VIEs that we do not sponsor and, accordingly, are unable to obtain the total assets of the entity.
163