Wells Fargo 2011 Annual Report Download - page 189
Download and view the complete annual report
Please find page 189 of the 2011 Wells Fargo annual report below. You can navigate through the pages in the report by either clicking on the pages listed below, or by using the keyword search tool below to find specific information within the annual report.-
 1
1 -
2
-
3
-
4
-
5
-
6
-
7
-
8
-
9
-
10
-
11
-
12
-
13
-
14
-
15
-
16
-
17
-
18
-
19
-
20
-
21
-
22
-
23
-
24
-
25
-
26
-
27
-
28
-
29
-
30
-
31
-
32
-
33
-
34
-
35
-
36
-
37
-
38
-
39
-
40
-
41
-
42
-
43
-
44
-
45
-
46
-
47
-
48
-
49
-
50
-
51
-
52
-
53
-
54
-
55
-
56
-
57
-
58
-
59
-
60
-
61
-
62
-
63
-
64
-
65
-
66
-
67
-
68
-
69
-
70
-
71
-
72
-
73
-
74
-
75
-
76
-
77
-
78
-
79
-
80
-
81
-
82
-
83
-
84
-
85
-
86
-
87
-
88
-
89
-
90
-
91
-
92
-
93
-
94
-
95
-
96
-
97
-
98
-
99
-
100
-
101
-
102
-
103
-
104
-
105
-
106
-
107
-
108
-
109
-
110
-
111
-
112
-
113
-
114
-
115
-
116
-
117
-
118
-
119
-
120
-
121
-
122
-
123
-
124
-
125
-
126
-
127
-
128
-
129
-
130
-
131
-
132
-
133
-
134
-
135
-
136
-
137
-
138
-
139
-
140
-
141
-
142
-
143
-
144
-
145
-
146
-
147
-
148
-
149
-
150
-
151
-
152
-
153
-
154
-
155
-
156
-
157
-
158
-
159
-
160
-
161
-
162
-
163
-
164
-
165
-
166
-
167
-
168
-
169
-
170
-
171
-
172
-
173
-
174
-
175
-
176
-
177
-
178
-
 179
179 -
 180
180 -
 181
181 -
 182
182 -
 183
183 -
 184
184 -
 185
185 -
 186
186 -
 187
187 -
 188
188 -
 189
189 -
 190
190 -
 191
191 -
 192
192 -
 193
193 -
 194
194 -
 195
195 -
 196
196 -
 197
197 -
 198
198 -
 199
199 -
200
-
201
-
202
-
203
-
204
-
205
-
206
-
207
-
208
-
209
-
210
-
211
-
212
-
213
-
214
-
215
-
216
-
217
-
218
-
219
-
220
-
221
-
222
-
223
-
224
-
225
-
226
-
227
-
228
-
229
-
230
-
231
-
232
-
233
-
234
-
235
-
236
-
237
-
238
-
239
-
240
 |
 |

Cash Flow Hedges
We hedge floating-rate debt against future interest rate increases
by using interest rate swaps, caps, floors and futures to limit
variability of cash flows due to changes in the benchmark
interest rate. We also use interest rate swaps and floors to hedge
the variability in interest payments received on certain floating-
rate commercial loans, due to changes in the benchmark interest
rate. Gains and losses on derivatives that are reclassified from
OCI to interest income and interest expense in the current
period are included in the line item in which the hedged item’s
effect on earnings is recorded. All parts of gain or loss on these
derivatives are included in the assessment of hedge effectiveness.
We assess hedge effectiveness using regression analysis, both at
inception of the hedging relationship and on an ongoing basis.
The regression analysis involves regressing the periodic changes
in cash flows of the hedging instrument against the periodic
changes in cash flows of the forecasted transaction being hedged
due to changes in the hedged risk(s). The assessment includes an
evaluation of the quantitative measures of the regression results
used to validate the conclusion of high effectiveness.
Based upon current interest rates, we estimate that
$440 million (pre-tax) of deferred net gains on derivatives in
OCI at December 31, 2011, will be reclassified into interest
income and interest expense during the next twelve months.
Future changes to interest rates may significantly change actual
amounts reclassified to earnings. We are hedging our exposure
to the variability of future cash flows for all forecasted
transactions for a maximum of 6 years for both hedges of
floating-rate debt and floating-rate commercial loans.
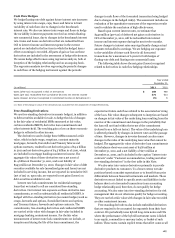
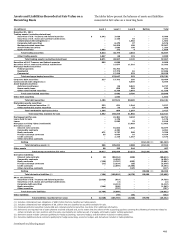
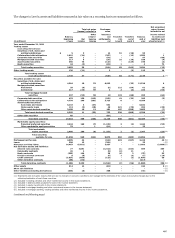
The following table shows the net gains (losses) recognized
related to derivatives in cash flow hedging relationships.
Year ended
December 31,
(in millions)
2011
2010
Gains (after tax) recognized in OCI on derivatives
$
105
468
Gains (pre tax) reclassified from cumulative OCI into net interest income
571
613
Gains (losses) (pre tax) recognized in noninterest income on derivatives (1)
(5)
6
(1) None of the change in value of the derivatives was excluded from the assessment of hedge effectiveness.
Free-Standing Derivatives
We use free-standing derivatives (economic hedges), in addition
to debt securities available for sale, to hedge the risk of changes
in the fair value of residential MSRs measured at fair value,
certain residential MHFS, derivative loan commitments and
other interests held. The resulting gain or loss on these economic
hedges is reflected in other income.
The derivatives used to hedge these MSRs measured at fair
value, which include swaps, swaptions, constant maturity
mortgages, forwards, Eurodollar and Treasury futures and
options contracts, resulted in net derivative gains of $5.2 billion
in 2011 and net derivative gains of $4.5 billion in of 2010, which
are included in mortgage banking noninterest income. The
aggregate fair value of these derivatives was a net asset of
$1.4 billion at December 31, 2011, and a net liability of
$943 million at December 31, 2010. Changes in fair value of debt
securities available for sale (unrealized gains and losses) are not
included in servicing income, but are reported in cumulative OCI
(net of tax) or, upon sale, are reported in net gains (losses) on
debt securities available for sale.
Interest rate lock commitments for residential mortgage
loans that we intend to sell are considered free-standing
derivatives. Our interest rate exposure on these derivative loan
commitments, as well as substantially all residential MHFS, is
hedged with free-standing derivatives (economic hedges) such as
swaps, forwards and options, Eurodollar futures and options,
and Treasury futures, forwards and options contracts. The
commitments, free-standing derivatives and residential MHFS
are carried at fair value with changes in fair value included in
mortgage banking noninterest income. For the fair value
measurement of interest rate lock commitments we include, at
inception and during the life of the loan commitment, the
expected net future cash flows related to the associated servicing
of the loan. Fair value changes subsequent to inception are based
on changes in fair value of the underlying loan resulting from the
exercise of the commitment and changes in the probability that
the loan will not fund within the terms of the commitment
(referred to as a fall-out factor). The value of the underlying loan
is affected primarily by changes in interest rates and the passage
of time. However, changes in investor demand can also cause
changes in the value of the underlying loan value that cannot be
hedged. The aggregate fair value of derivative loan commitments
in the balance sheet was a net asset of $478 million at
December 31, 2011, and a net liability of $271 million at
December 31, 2010, and is included in the caption “Interest rate
contracts” under “Customer accommodation, trading and other
free-standing derivatives” in the first table in this Note.
We also enter into various derivatives primarily to provide
derivative products to customers. To a lesser extent, we take
positions based on market expectations or to benefit from price
differentials between financial instruments and markets. These
derivatives are not linked to specific assets and liabilities in the
balance sheet or to forecasted transactions in an accounting
hedge relationship and, therefore, do not qualify for hedge
accounting. We also enter into free-standing derivatives for risk
management that do not otherwise qualify for hedge accounting.
They are carried at fair value with changes in fair value recorded
as other noninterest income.
Free-standing derivatives also include embedded derivatives
that are required to be accounted for separately from their host
contract. We periodically issue hybrid long-term notes and CDs
where the performance of the hybrid instrument notes is linked
to an equity, commodity or currency index, or basket of such
indices. These notes contain explicit terms that affect some or all
187