Wells Fargo 2011 Annual Report Download - page 51
Download and view the complete annual report
Please find page 51 of the 2011 Wells Fargo annual report below. You can navigate through the pages in the report by either clicking on the pages listed below, or by using the keyword search tool below to find specific information within the annual report.-
 1
1 -
2
-
3
-
4
-
5
-
6
-
7
-
8
-
9
-
10
-
11
-
12
-
13
-
14
-
15
-
16
-
17
-
18
-
19
-
20
-
21
-
22
-
23
-
24
-
25
-
26
-
27
-
28
-
29
-
30
-
31
-
32
-
33
-
34
-
35
-
36
-
37
-
38
-
39
-
40
-
 41
41 -
 42
42 -
 43
43 -
 44
44 -
 45
45 -
 46
46 -
 47
47 -
 48
48 -
 49
49 -
 50
50 -
 51
51 -
 52
52 -
 53
53 -
 54
54 -
 55
55 -
 56
56 -
 57
57 -
 58
58 -
 59
59 -
 60
60 -
 61
61 -
62
-
63
-
64
-
65
-
66
-
67
-
68
-
69
-
70
-
71
-
72
-
73
-
74
-
75
-
76
-
77
-
78
-
79
-
80
-
81
-
82
-
83
-
84
-
85
-
86
-
87
-
88
-
89
-
90
-
91
-
92
-
93
-
94
-
95
-
96
-
97
-
98
-
99
-
100
-
101
-
102
-
103
-
104
-
105
-
106
-
107
-
108
-
109
-
110
-
111
-
112
-
113
-
114
-
115
-
116
-
117
-
118
-
119
-
120
-
121
-
122
-
123
-
124
-
125
-
126
-
127
-
128
-
129
-
130
-
131
-
132
-
133
-
134
-
135
-
136
-
137
-
138
-
139
-
140
-
141
-
142
-
143
-
144
-
145
-
146
-
147
-
148
-
149
-
150
-
151
-
152
-
153
-
154
-
155
-
156
-
157
-
158
-
159
-
160
-
161
-
162
-
163
-
164
-
165
-
166
-
167
-
168
-
169
-
170
-
171
-
172
-
173
-
174
-
175
-
176
-
177
-
178
-
179
-
180
-
181
-
182
-
183
-
184
-
185
-
186
-
187
-
188
-
189
-
190
-
191
-
192
-
193
-
194
-
195
-
196
-
197
-
198
-
199
-
200
-
201
-
202
-
203
-
204
-
205
-
206
-
207
-
208
-
209
-
210
-
211
-
212
-
213
-
214
-
215
-
216
-
217
-
218
-
219
-
220
-
221
-
222
-
223
-
224
-
225
-
226
-
227
-
228
-
229
-
230
-
231
-
232
-
233
-
234
-
235
-
236
-
237
-
238
-
239
-
240
 |
 |

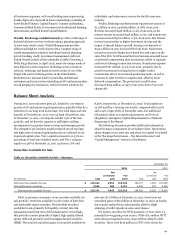
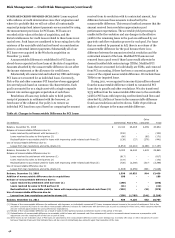
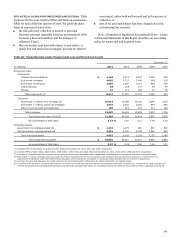
Since December 31, 2008, we have released $5.9 billion in
nonaccretable difference, including $4.2 billion transferred from
the nonaccretable difference to the accretable yield and
$1.7 billion released to income through loan resolutions. We
have provided $1.8 billion in the allowance for credit losses for
certain PCI loans or pools of PCI loans that have had credit-
related decreases to cash flows expected to be collected. The net
result is a $4.2 billion reduction from December 31, 2008,
through December 31, 2011, in our initial projected losses on all
PCI loans.
At December 31, 2011, the allowance for credit losses on
certain PCI loans was $231 million. The allowance is necessary
to absorb credit-related decreases since acquisition in cash flows
expected to be collected and primarily relates to individual PCI
loans. Table 19 analyzes the actual and projected loss results on
PCI loans since acquisition through December 31, 2011.
For additional information on PCI loans, see Note 1
(Summary of Significant Accounting Policies – Loans) and Note
6 (Loans and Allowance for Credit Losses) to Financial
Statements in this Report.
Table 19: Actual and Projected Loss Results on PCI Loans
Other
(in millions)
Commercial
Pick-a-Pay
consumer
Total
Release of nonaccretable difference due to:
Loans resolved by settlement with borrower (1)
$
1,345
-
-
1,345
Loans resolved by sales to third parties (2)
299
-
85
384
Reclassification to accretable yield for loans with improving credit-related cash flows (3)
1,216
2,383
614
4,213
Total releases of nonaccretable difference due to better than expected losses
2,860
2,383
699
5,942
Provision for losses due to credit deterioration (4)
(1,668)
-
(116)
(1,784)
Actual and projected losses on PCI loans less than originally expected
$
1,192
2,383
583
4,158
(1)
Release of the nonaccretable difference for settlement with borrower, on individually accounted PCI loans, increases interest income in the period of settlement. Pick-a-Pay
and Other consumer P
CI loans do not reflect nonaccretable difference releases for settlements with borrowers due to pool accounting for those loa
ns, which assumes that the
amount received approximates the pool performance expectations.
(2)
Release of the nonaccretable difference as a result of sales to third parties increases noninterest income in the period of the sale.
(3)
Reclassification of nonaccretable difference to accretable yield for loans with increased cash flow estimates will result in increased interest income as a prospective yield
adjustment over the remaining life of the loan or pool of loans.
(4)
Provision for additional losses recorded as a charge to income, when it is estimated that the cash flows expected to be collected for a PCI loan or pool of loans may not
support full realization of the carrying value.
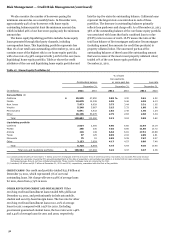
Significant Portfolio Reviews
Measuring and monitoring our
credit risk is an ongoing process that tracks delinquencies,
collateral values, FICO scores, economic trends by geographic
areas, loan-level risk grading for certain portfolios (typically
commercial) and other indications of credit risk. Our credit risk
monitoring process is designed to enable early identification of
developing risk and to support our determination of an
appropriate allowance for credit losses. The following analysis
reviews the relevant concentrations and certain credit metrics of
our significant portfolios. See Note 6 (Loans and Allowance for
Credit Losses) to Financial Statements in this Report for more
analysis and credit metric information.
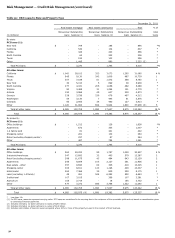
COMMERCIAL REAL ESTATE (CRE)
The CRE portfolio,
consisting of both CRE mortgage loans and CRE construction
loans, totaled $125.4 billion, or 16% of total loans, at
December 31, 2011. CRE construction loans totaled $19.4 billion
at December 31, 2011, and CRE mortgage loans totaled
$106.0 billion, of which 33% was to owner-occupants. Table 20
summarizes CRE loans by state and property type with the
related nonaccrual totals. CRE nonaccrual loans totaled 5% of
the non-PCI CRE outstanding balance at December 31, 2011, a
decline of 24% from December 31, 2010. The portfolio is
diversified both geographically and by property type. The largest
geographic concentrations of combined CRE loans are in
California and Florida, which represented 25% and 9% of the
total CRE portfolio, respectively. By property type, the largest
concentrations are office buildings at 26% and
industrial/warehouse at 11% of the portfolio. We subject
commercial loans to individual risk assessment using our
internal borrower and collateral quality ratings. Our ratings are
aligned to pass and criticized categories with our criticized
categories aligned to special mention, substandard and doubtful
categories as defined by bank regulatory agencies. At December
31, 2011, we had $22.5 billion of criticized non-PCI CRE
mortgage loans, a decrease of 13% from December 31, 2010, and
$6.8 billion of criticized non-PCI construction loans, a decrease
of 39% from December 31, 2010. Total criticized non-PCI CRE
loans remained relatively high as a result of the continued
challenging conditions in the real estate market. See Note 6
(Loans and Allowance for Credit Losses) to Financial Statements
in this Report for further detail on criticized loans.
The underwriting of CRE loans primarily focuses on cash
flows inherent in the creditworthiness of the customer, in
addition to collateral valuations. To identify and manage newly
emerging problem CRE loans, we employ a high level of
monitoring and regular customer interaction to understand and
manage the risks associated with these loans, including regular
loan reviews and appraisal updates. Management is engaged to
identify issues and dedicated workout groups are in place to
manage problem loans. At December 31, 2011, the recorded
investment in PCI CRE loans totaled $5.0 billion, down from
$12.3 billion at December 31, 2008, reflecting the reduction
resulting from principal payments, loan resolutions and write-
downs.
49