Wells Fargo 2011 Annual Report Download - page 32
Download and view the complete annual report
Please find page 32 of the 2011 Wells Fargo annual report below. You can navigate through the pages in the report by either clicking on the pages listed below, or by using the keyword search tool below to find specific information within the annual report.-
 1
1 -
2
-
3
-
4
-
5
-
6
-
7
-
8
-
9
-
10
-
11
-
12
-
13
-
14
-
15
-
16
-
17
-
18
-
19
-
20
-
21
-
 22
22 -
 23
23 -
 24
24 -
 25
25 -
 26
26 -
 27
27 -
 28
28 -
 29
29 -
 30
30 -
 31
31 -
 32
32 -
 33
33 -
 34
34 -
 35
35 -
 36
36 -
 37
37 -
 38
38 -
 39
39 -
 40
40 -
 41
41 -
 42
42 -
43
-
44
-
45
-
46
-
47
-
48
-
49
-
50
-
51
-
52
-
53
-
54
-
55
-
56
-
57
-
58
-
59
-
60
-
61
-
62
-
63
-
64
-
65
-
66
-
67
-
68
-
69
-
70
-
71
-
72
-
73
-
74
-
75
-
76
-
77
-
78
-
79
-
80
-
81
-
82
-
83
-
84
-
85
-
86
-
87
-
88
-
89
-
90
-
91
-
92
-
93
-
94
-
95
-
96
-
97
-
98
-
99
-
100
-
101
-
102
-
103
-
104
-
105
-
106
-
107
-
108
-
109
-
110
-
111
-
112
-
113
-
114
-
115
-
116
-
117
-
118
-
119
-
120
-
121
-
122
-
123
-
124
-
125
-
126
-
127
-
128
-
129
-
130
-
131
-
132
-
133
-
134
-
135
-
136
-
137
-
138
-
139
-
140
-
141
-
142
-
143
-
144
-
145
-
146
-
147
-
148
-
149
-
150
-
151
-
152
-
153
-
154
-
155
-
156
-
157
-
158
-
159
-
160
-
161
-
162
-
163
-
164
-
165
-
166
-
167
-
168
-
169
-
170
-
171
-
172
-
173
-
174
-
175
-
176
-
177
-
178
-
179
-
180
-
181
-
182
-
183
-
184
-
185
-
186
-
187
-
188
-
189
-
190
-
191
-
192
-
193
-
194
-
195
-
196
-
197
-
198
-
199
-
200
-
201
-
202
-
203
-
204
-
205
-
206
-
207
-
208
-
209
-
210
-
211
-
212
-
213
-
214
-
215
-
216
-
217
-
218
-
219
-
220
-
221
-
222
-
223
-
224
-
225
-
226
-
227
-
228
-
229
-
230
-
231
-
232
-
233
-
234
-
235
-
236
-
237
-
238
-
239
-
240
 |
 |

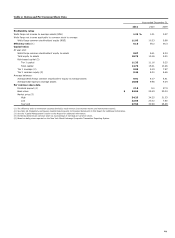
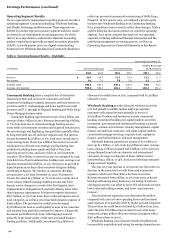
Earnings Performance
Wells Fargo net income for 2011 was $15.9 billion ($2.82 diluted
earnings per common share) compared with $12.4 billion
($2.21 diluted earnings per common share) for 2010 and
$12.3 billion ($1.75 diluted earnings per common share) for
2009. Our 2011 earnings reflected strong execution of our
business strategy in a difficult economic environment. The key
drivers of our financial performance in 2011 were improved
credit quality, lower operating costs, diversified sources of fee
income, balanced net interest and fee income, a diversified loan
portfolio and increased deposits.
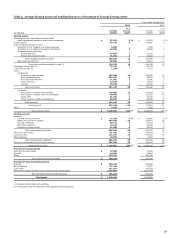
Revenue, the sum of net interest income and noninterest
income, was $80.9 billion in 2011, compared with $85.2 billion
in 2010 and $88.7 billion in 2009. The decline in revenue in
2011 was predominantly due to lower net interest income,
mortgage banking and net gains from trading activities. Net
interest income of $42.8 billion in 2011, represented 53% of
revenue, compared with $44.8 billion (53%) in 2010 and
$46.3 billion (52%) in 2009. The 4% decline in 2011 net interest
income from 2010 reflected a 32 basis points decline in the net
interest margin and a 2% decline in average loans. The decline in
average loans from 2010 reflected reductions in the non-
strategic and liquidating loan portfolios, partially offset by loan
growth and loan acquisitions. Continued success in generating
low-cost deposits enabled the Company to grow assets by
funding loan and securities growth while reducing higher cost
long-term debt.
Noninterest income was $38.2 billion in 2011, representing
47% of revenue, compared with $40.5 billion (47%) in 2010 and
$42.4 billion (48%) in 2009. The decrease in noninterest income
in 2011 was due largely to lower service charges on deposit
accounts, net gains on mortgage loan origination/sales activities
and net gains from trading activities.
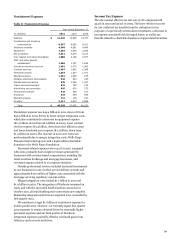
Noninterest expense was $49.4 billion in 2011, compared
with $50.5 billion in 2010 and $49.0 billion in 2009.
Noninterest expense as a percentage of revenue was 61% in 2011,
59% in 2010 and 55% in 2009. Noninterest expense for 2011
included $1.7 billion of Wachovia merger-related integration
expense, compared with $1.9 billion in 2010 and $895 million in
2009.
Table 3 presents the components of revenue and noninterest
expense as a percentage of revenue for year-over-year results.
30