Wells Fargo 2011 Annual Report Download - page 178
Download and view the complete annual report
Please find page 178 of the 2011 Wells Fargo annual report below. You can navigate through the pages in the report by either clicking on the pages listed below, or by using the keyword search tool below to find specific information within the annual report.-
 1
1 -
2
-
3
-
4
-
5
-
6
-
7
-
8
-
9
-
10
-
11
-
12
-
13
-
14
-
15
-
16
-
17
-
18
-
19
-
20
-
21
-
22
-
23
-
24
-
25
-
26
-
27
-
28
-
29
-
30
-
31
-
32
-
33
-
34
-
35
-
36
-
37
-
38
-
39
-
40
-
41
-
42
-
43
-
44
-
45
-
46
-
47
-
48
-
49
-
50
-
51
-
52
-
53
-
54
-
55
-
56
-
57
-
58
-
59
-
60
-
61
-
62
-
63
-
64
-
65
-
66
-
67
-
68
-
69
-
70
-
71
-
72
-
73
-
74
-
75
-
76
-
77
-
78
-
79
-
80
-
81
-
82
-
83
-
84
-
85
-
86
-
87
-
88
-
89
-
90
-
91
-
92
-
93
-
94
-
95
-
96
-
97
-
98
-
99
-
100
-
101
-
102
-
103
-
104
-
105
-
106
-
107
-
108
-
109
-
110
-
111
-
112
-
113
-
114
-
115
-
116
-
117
-
118
-
119
-
120
-
121
-
122
-
123
-
124
-
125
-
126
-
127
-
128
-
129
-
130
-
131
-
132
-
133
-
134
-
135
-
136
-
137
-
138
-
139
-
140
-
141
-
142
-
143
-
144
-
145
-
146
-
147
-
148
-
149
-
150
-
151
-
152
-
153
-
154
-
155
-
156
-
157
-
158
-
159
-
160
-
161
-
162
-
163
-
164
-
165
-
166
-
167
-
 168
168 -
 169
169 -
 170
170 -
 171
171 -
 172
172 -
 173
173 -
 174
174 -
 175
175 -
 176
176 -
 177
177 -
 178
178 -
 179
179 -
 180
180 -
 181
181 -
 182
182 -
 183
183 -
 184
184 -
 185
185 -
 186
186 -
 187
187 -
 188
188 -
189
-
190
-
191
-
192
-
193
-
194
-
195
-
196
-
197
-
198
-
199
-
200
-
201
-
202
-
203
-
204
-
205
-
206
-
207
-
208
-
209
-
210
-
211
-
212
-
213
-
214
-
215
-
216
-
217
-
218
-
219
-
220
-
221
-
222
-
223
-
224
-
225
-
226
-
227
-
228
-
229
-
230
-
231
-
232
-
233
-
234
-
235
-
236
-
237
-
238
-
239
-
240
 |
 |

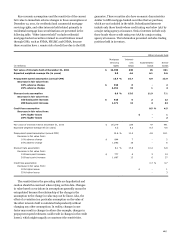
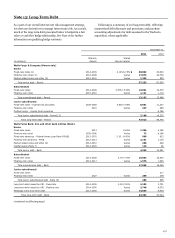
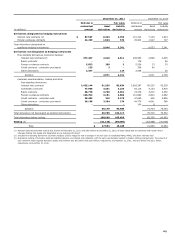
Note 12: Short-Term Borrowings
The table below shows selected information for short-term
borrowings, which generally mature in less than 30 days.
2011
2010
2009
(in millions)
Amount
Rate
Amount
Rate
Amount
Rate
As of December 31,
Commercial paper and other short-term borrowings
$
18,053
0.19
%
$
17,454
0.26
%
$
12,950
0.39
%
Federal funds purchased and securities sold
under agreements to repurchase
31,038
0.05
37,947
0.15
26,016
0.08
Total
$
49,091
0.10
$
55,401
0.19
$
38,966
0.18
Year ended December 31,
Average daily balance
Commercial paper and other short-term borrowings
$
17,393
0.33
$
16,330
0.31
$
27,793
0.43
Federal funds purchased and securities sold
under agreements to repurchase
34,388
0.11
30,494
0.18
24,179
0.46
Total
$
51,781
0.18
$
46,824
0.22
$
51,972
0.44
Maximum month-end balance
Commercial paper and other short-term borrowings (1)
$
18,234
N/A
$
17,646
N/A
$
62,871
N/A
Federal funds purchased and securities sold
under agreements to repurchase (2)
37,509
N/A
37,947
N/A
30,608
N/A
N/A- Not Applicable
(1) Highest month-end balance in each of the last three years was April 2011, March 2010 and February 2009.
(2) Highest month-end balance in each of the last three years was March 2011, December 2010 and February 2009.
176