Wells Fargo 2011 Annual Report Download - page 228
Download and view the complete annual report
Please find page 228 of the 2011 Wells Fargo annual report below. You can navigate through the pages in the report by either clicking on the pages listed below, or by using the keyword search tool below to find specific information within the annual report.-
 1
1 -
2
-
3
-
4
-
5
-
6
-
7
-
8
-
9
-
10
-
11
-
12
-
13
-
14
-
15
-
16
-
17
-
18
-
19
-
20
-
21
-
22
-
23
-
24
-
25
-
26
-
27
-
28
-
29
-
30
-
31
-
32
-
33
-
34
-
35
-
36
-
37
-
38
-
39
-
40
-
41
-
42
-
43
-
44
-
45
-
46
-
47
-
48
-
49
-
50
-
51
-
52
-
53
-
54
-
55
-
56
-
57
-
58
-
59
-
60
-
61
-
62
-
63
-
64
-
65
-
66
-
67
-
68
-
69
-
70
-
71
-
72
-
73
-
74
-
75
-
76
-
77
-
78
-
79
-
80
-
81
-
82
-
83
-
84
-
85
-
86
-
87
-
88
-
89
-
90
-
91
-
92
-
93
-
94
-
95
-
96
-
97
-
98
-
99
-
100
-
101
-
102
-
103
-
104
-
105
-
106
-
107
-
108
-
109
-
110
-
111
-
112
-
113
-
114
-
115
-
116
-
117
-
118
-
119
-
120
-
121
-
122
-
123
-
124
-
125
-
126
-
127
-
128
-
129
-
130
-
131
-
132
-
133
-
134
-
135
-
136
-
137
-
138
-
139
-
140
-
141
-
142
-
143
-
144
-
145
-
146
-
147
-
148
-
149
-
150
-
151
-
152
-
153
-
154
-
155
-
156
-
157
-
158
-
159
-
160
-
161
-
162
-
163
-
164
-
165
-
166
-
167
-
168
-
169
-
170
-
171
-
172
-
173
-
174
-
175
-
176
-
177
-
178
-
179
-
180
-
181
-
182
-
183
-
184
-
185
-
186
-
187
-
188
-
189
-
190
-
191
-
192
-
193
-
194
-
195
-
196
-
197
-
198
-
199
-
200
-
201
-
202
-
203
-
204
-
205
-
206
-
207
-
208
-
209
-
210
-
211
-
212
-
213
-
214
-
215
-
216
-
217
-
 218
218 -
 219
219 -
 220
220 -
 221
221 -
 222
222 -
 223
223 -
 224
224 -
 225
225 -
 226
226 -
 227
227 -
 228
228 -
 229
229 -
 230
230 -
 231
231 -
 232
232 -
 233
233 -
 234
234 -
 235
235 -
 236
236 -
 237
237 -
 238
238 -
239
-
240
 |
 |

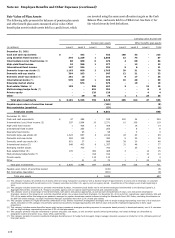
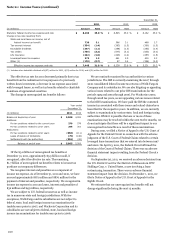
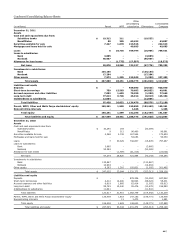
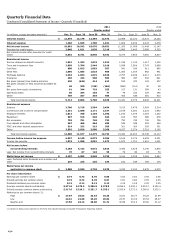
Note 25: Condensed Consolidating Financial Statements (continued)
Condensed Consolidating Statements of Income
Other
consolidating
Consolidated
(in millions)
Parent
WFFI
subsidiaries
Eliminations
Company
Year ended December 31, 2010
Dividends from subsidiaries:
Bank
$
12,896
-
-
(12,896)
-
Nonbank
21
-
-
(21)
-
Interest income from loans
-
2,674
37,404
(318)
39,760
Interest income from subsidiaries
1,375
-
14
(1,389)
-
Other interest income
304
116
12,616
-
13,036
Total interest income
14,596
2,790
50,034
(14,624)
52,796
Deposits
-
-
2,832
-
2,832
Short-term borrowings
277
46
586
(817)
92
Long-term debt
2,910
963
1,905
(890)
4,888
Other interest expense
2
-
225
-
227
Total interest expense
3,189
1,009
5,548
(1,707)
8,039
Net interest income
11,407
1,781
44,486
(12,917)
44,757
Provision for credit losses
-
1,064
14,689
-
15,753
Net interest income after provision for credit losses
11,407
717
29,797
(12,917)
29,004
Noninterest income
Fee income – nonaffiliates
-
107
23,385
-
23,492
Other
363
145
17,111
(658)
16,961
Total noninterest income
363
252
40,496
(658)
40,453
Noninterest expense
Salaries and benefits
143
150
26,919
-
27,212
Other
1,192
632
22,078
(658)
23,244
Total noninterest expense
1,335
782
48,997
(658)
50,456
Income (loss) before income tax expense (benefit) and
equity in undistributed income of subsidiaries
10,435
187
21,296
(12,917)
19,001
Income tax expense (benefit)
(749)
62
7,025
-
6,338
Equity in undistributed income of subsidiaries
1,178
-
-
(1,178)
-
Net income (loss) before noncontrolling interests
12,362
125
14,271
(14,095)
12,663
Less: Net income from noncontrolling interests
-
-
301
-
301
Parent, WFFI, Other and Wells Fargo net income (loss)
$
12,362
125
13,970
(14,095)
12,362
Year ended December 31, 2009
Dividends from subsidiaries:
Bank
$
6,974
-
-
(6,974)
-
Nonbank
528
-
-
(528)
-
Interest income from loans
-
3,467
38,140
(18)
41,589
Interest income from subsidiaries
2,126
-
-
(2,126)
-
Other interest income
424
111
14,150
-
14,685
Total interest income
10,052
3,578
52,290
(9,646)
56,274
Deposits
-
-
3,774
-
3,774
Short-term borrowings
174
38
782
(772)
222
Long-term debt
3,391
1,305
2,458
(1,372)
5,782
Other interest expense
-
-
172
-
172
Total interest expense
3,565
1,343
7,186
(2,144)
9,950
Net interest income
6,487
2,235
45,104
(7,502)
46,324
Provision for credit losses
-
1,901
19,767
-
21,668
Net interest income after provision for credit losses
6,487
334
25,337
(7,502)
24,656
Noninterest income
Fee income – nonaffiliates
-
148
22,815
-
22,963
Other
738
169
19,135
(643)
19,399
Total noninterest income
738
317
41,950
(643)
42,362
Noninterest expense
Salaries and benefits
320
129
26,018
-
26,467
Other
521
711
21,964
(643)
22,553
Total noninterest expense
841
840
47,982
(643)
49,020
Income (loss) before income tax expense (benefit) and
equity in undistributed income of subsidiaries
6,384
(189)
19,305
(7,502)
17,998
Income tax expense (benefit)
(164)
(86)
5,581
-
5,331
Equity in undistributed income of subsidiaries
5,727
-
-
(5,727)
-
Net income (loss) before noncontrolling interests
12,275
(103)
13,724
(13,229)
12,667
Less: Net income from noncontrolling interests
-
1
391
-
392
Parent, WFFI, Other and Wells Fargo net income (loss)
$
12,275
(104)
13,333
(13,229)
12,275
226