Wells Fargo 2011 Annual Report Download - page 171
Download and view the complete annual report
Please find page 171 of the 2011 Wells Fargo annual report below. You can navigate through the pages in the report by either clicking on the pages listed below, or by using the keyword search tool below to find specific information within the annual report.-
 1
1 -
2
-
3
-
4
-
5
-
6
-
7
-
8
-
9
-
10
-
11
-
12
-
13
-
14
-
15
-
16
-
17
-
18
-
19
-
20
-
21
-
22
-
23
-
24
-
25
-
26
-
27
-
28
-
29
-
30
-
31
-
32
-
33
-
34
-
35
-
36
-
37
-
38
-
39
-
40
-
41
-
42
-
43
-
44
-
45
-
46
-
47
-
48
-
49
-
50
-
51
-
52
-
53
-
54
-
55
-
56
-
57
-
58
-
59
-
60
-
61
-
62
-
63
-
64
-
65
-
66
-
67
-
68
-
69
-
70
-
71
-
72
-
73
-
74
-
75
-
76
-
77
-
78
-
79
-
80
-
81
-
82
-
83
-
84
-
85
-
86
-
87
-
88
-
89
-
90
-
91
-
92
-
93
-
94
-
95
-
96
-
97
-
98
-
99
-
100
-
101
-
102
-
103
-
104
-
105
-
106
-
107
-
108
-
109
-
110
-
111
-
112
-
113
-
114
-
115
-
116
-
117
-
118
-
119
-
120
-
121
-
122
-
123
-
124
-
125
-
126
-
127
-
128
-
129
-
130
-
131
-
132
-
133
-
134
-
135
-
136
-
137
-
138
-
139
-
140
-
141
-
142
-
143
-
144
-
145
-
146
-
147
-
148
-
149
-
150
-
151
-
152
-
153
-
154
-
155
-
156
-
157
-
158
-
159
-
160
-
 161
161 -
 162
162 -
 163
163 -
 164
164 -
 165
165 -
 166
166 -
 167
167 -
 168
168 -
 169
169 -
 170
170 -
 171
171 -
 172
172 -
 173
173 -
 174
174 -
 175
175 -
 176
176 -
 177
177 -
 178
178 -
 179
179 -
 180
180 -
 181
181 -
182
-
183
-
184
-
185
-
186
-
187
-
188
-
189
-
190
-
191
-
192
-
193
-
194
-
195
-
196
-
197
-
198
-
199
-
200
-
201
-
202
-
203
-
204
-
205
-
206
-
207
-
208
-
209
-
210
-
211
-
212
-
213
-
214
-
215
-
216
-
217
-
218
-
219
-
220
-
221
-
222
-
223
-
224
-
225
-
226
-
227
-
228
-
229
-
230
-
231
-
232
-
233
-
234
-
235
-
236
-
237
-
238
-
239
-
240
 |
 |
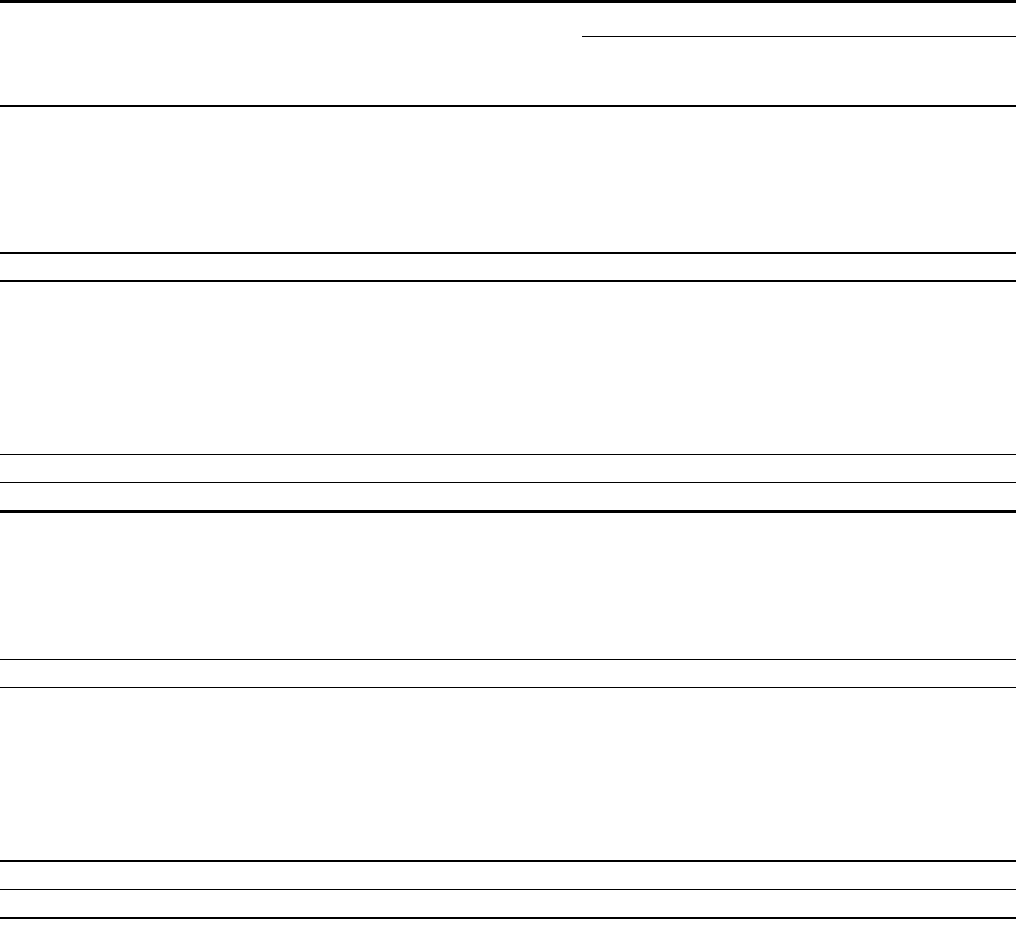
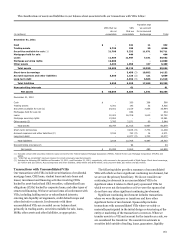
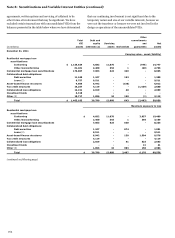
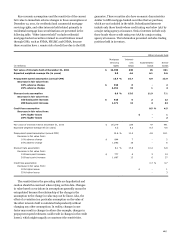
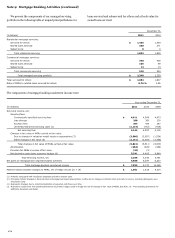
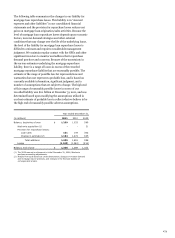
Transactions with Consolidated VIEs and Secured
Borrowings
The following table presents a summary of transfers of financial
assets accounted for as secured borrowings and involvements
with consolidated VIEs. “Consolidated assets” are presented
using GAAP measurement methods, which may include fair
value, credit impairment or other adjustments, and therefore in
some instances will differ from “Total VIE assets.” For VIEs that
obtain exposure synthetically through derivative instruments,
the remaining notional amount of the derivative is included in
“Total VIE assets.” On the consolidated balance sheet, we
separately disclose the consolidated assets of certain VIEs that
can only be used to settle the liabilities of those VIEs.
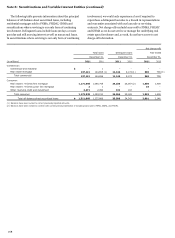
Carrying value
Total
Third
VIE
Consolidated
party
Noncontrolling
Net
(in millions)
assets
assets
liabilities
interests
assets
December 31, 2011
Secured borrowings:
Municipal tender option bond securitizations
$
14,168
11,748
(10,689)
-
1,059
Auto loan securitizations
-
-
-
-
-
Commercial real estate loans
1,168
1,168
(1,041)
-
127
Residential mortgage securitizations (1)
5,705
6,114
(5,759)
-
355
Total secured borrowings
21,041
19,030
(17,489)
-
1,541
Consolidated VIEs:
Nonconforming residential
mortgage loan securitizations
11,375
10,244
(4,514)
-
5,730
Multi-seller commercial paper conduit
2,860
2,860
(2,935)
-
(75)
Auto loan securitizations
163
163
(143)
-
20
Structured asset finance
124
124
(16)
-
108
Investment funds
2,012
2,012
(22)
-
1,990
Other
3,432
2,812
(1,890)
(61)
861
Total consolidated VIEs
19,966
18,215
(9,520)
(61)
8,634
Total secured borrowings and consolidated VIEs
$
41,007
37,245
(27,009)
(61)
10,175
December 31, 2010
Secured borrowings:
Municipal tender option bond securitizations
$
10,687
7,874
(7,779)
-
95
Auto loan securitizations
154
154
-
-
154
Commercial real estate loans
1,321
1,321
(1,272)
-
49
Residential mortgage securitizations
700
618
(436)
-
182
Total secured borrowings
12,862
9,967
(9,487)
-
480
Consolidated VIEs:
Nonconforming residential
mortgage loan securitizations
14,518
13,529
(6,723)
-
6,806
Multi-seller commercial paper conduit
3,197
3,197
(3,279)
-
(82)
Auto loan securitizations
1,010
1,010
(955)
-
55
Structured asset finance
146
146
(21)
(11)
114
Investment funds
1,197
1,197
(54)
(14)
1,129
Other (2)
2,938
2,836
(1,724)
(69)
1,043
Total consolidated VIEs
23,006
21,915
(12,756)
(94)
9,065
Total secured borrowings and consolidated VIEs
$
35,868
31,882
(22,243)
(94)
9,545
(1) Includes $5.6 billion of reverse mortgage loans that were previously accounted for as a sale to a GNMA securitization program.
(2) Revised to correct previously reported amounts.
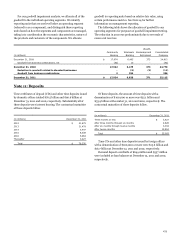
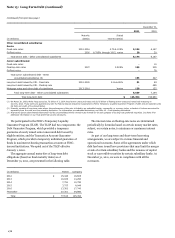
In addition to the transactions included in the table above, at
December 31, 2011, we had issued approximately $6.0 billion of
private placement debt financing through a consolidated VIE.
The issuance is classified as long-term debt in our consolidated
financial statements. At December 31, 2011, we had pledged
approximately $6.2 billion in loans (principal and interest
eligible to be capitalized), $316 million in securities available for
sale and $154 million in cash and cash equivalents to
collateralize the VIE’s borrowings. Such assets were not
transferred to the VIE and accordingly we have excluded the VIE
from the previous table.
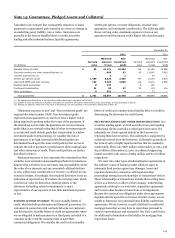
We have raised financing through the securitization of certain
financial assets in transactions with VIEs accounted for as
secured borrowings. We also consolidate VIEs where we are the
primary beneficiary. In certain transactions other than the
multi-seller commercial paper conduit, we provide contractual
support in the form of limited recourse and liquidity to facilitate
the remarketing of short-term securities issued to third party
169