Wells Fargo 2011 Annual Report Download - page 49
Download and view the complete annual report
Please find page 49 of the 2011 Wells Fargo annual report below. You can navigate through the pages in the report by either clicking on the pages listed below, or by using the keyword search tool below to find specific information within the annual report.-
 1
1 -
2
-
3
-
4
-
5
-
6
-
7
-
8
-
9
-
10
-
11
-
12
-
13
-
14
-
15
-
16
-
17
-
18
-
19
-
20
-
21
-
22
-
23
-
24
-
25
-
26
-
27
-
28
-
29
-
30
-
31
-
32
-
33
-
34
-
35
-
36
-
37
-
38
-
 39
39 -
 40
40 -
 41
41 -
 42
42 -
 43
43 -
 44
44 -
 45
45 -
 46
46 -
 47
47 -
 48
48 -
 49
49 -
 50
50 -
 51
51 -
 52
52 -
 53
53 -
 54
54 -
 55
55 -
 56
56 -
 57
57 -
 58
58 -
 59
59 -
60
-
61
-
62
-
63
-
64
-
65
-
66
-
67
-
68
-
69
-
70
-
71
-
72
-
73
-
74
-
75
-
76
-
77
-
78
-
79
-
80
-
81
-
82
-
83
-
84
-
85
-
86
-
87
-
88
-
89
-
90
-
91
-
92
-
93
-
94
-
95
-
96
-
97
-
98
-
99
-
100
-
101
-
102
-
103
-
104
-
105
-
106
-
107
-
108
-
109
-
110
-
111
-
112
-
113
-
114
-
115
-
116
-
117
-
118
-
119
-
120
-
121
-
122
-
123
-
124
-
125
-
126
-
127
-
128
-
129
-
130
-
131
-
132
-
133
-
134
-
135
-
136
-
137
-
138
-
139
-
140
-
141
-
142
-
143
-
144
-
145
-
146
-
147
-
148
-
149
-
150
-
151
-
152
-
153
-
154
-
155
-
156
-
157
-
158
-
159
-
160
-
161
-
162
-
163
-
164
-
165
-
166
-
167
-
168
-
169
-
170
-
171
-
172
-
173
-
174
-
175
-
176
-
177
-
178
-
179
-
180
-
181
-
182
-
183
-
184
-
185
-
186
-
187
-
188
-
189
-
190
-
191
-
192
-
193
-
194
-
195
-
196
-
197
-
198
-
199
-
200
-
201
-
202
-
203
-
204
-
205
-
206
-
207
-
208
-
209
-
210
-
211
-
212
-
213
-
214
-
215
-
216
-
217
-
218
-
219
-
220
-
221
-
222
-
223
-
224
-
225
-
226
-
227
-
228
-
229
-
230
-
231
-
232
-
233
-
234
-
235
-
236
-
237
-
238
-
239
-
240
 |
 |

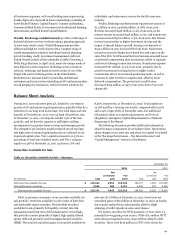
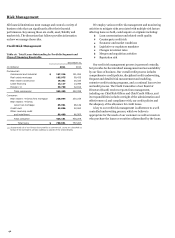
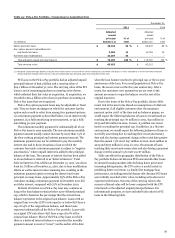
Non-Strategic and Liquidating Loan Portfolios
We
continually evaluate and modify our credit policies to address
appropriate levels of risk. We may designate certain portfolios
and loan products as non-strategic or liquidating to cease their
continued origination as we actively work to limit losses and
reduce our exposures.
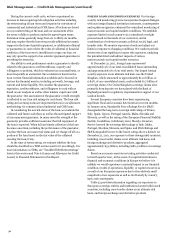
Table 17 identifies our non-strategic and liquidating loan
portfolios. They consist primarily of the Pick-a-Pay mortgage
portfolio and other PCI loans acquired from Wachovia as well
as some portfolios from legacy Wells Fargo Home Equity and
Wells Fargo Financial. Effective first quarter 2011, we added
our education finance government guaranteed loan portfolio to
the non-strategic and liquidating loan portfolios as there is no
longer a U.S. Government guaranteed student loan program
available to private financial institutions pursuant to legislation
in 2010. The outstanding balances on non-strategic and
liquidating loan portfolios have decreased 41% since the
merger with Wachovia at December 31, 2008, and decreased
16% from the end of 2010.
Table 17: Non-Strategic and Liquidating Loan Portfolios
Outstanding balance
December 31,
(in millions)
2011
2010
2009
2008
Commercial:
Legacy Wachovia commercial and industrial, CRE and foreign PCI loans (1)
$
5,695
7,935
12,988
18,704
Total commercial
5,695
7,935
12,988
18,704
Consumer:
Pick-a-Pay mortgage (1)
65,652
74,815
85,238
95,315
Liquidating home equity
5,710
6,904
8,429
10,309
Legacy Wells Fargo Financial indirect auto
2,455
6,002
11,253
18,221
Legacy Wells Fargo Financial debt consolidation
16,542
19,020
22,364
25,299
Education Finance - government guaranteed (2)
15,376
17,510
21,150
20,465
Legacy Wachovia other PCI loans (1)
896
1,118
1,688
2,478
Total consumer
106,631
125,369
150,122
172,087
Total non-strategic and liquidating loan portfolios
$
112,326
133,304
163,110
190,791
(1)
Net of purchase accounting adjustments related to PCI loans.
(2)
Effective first quarter 2011, we included our education finance government guaranteed loan portfolio as there is no longer a U.S. Government guaranteed student loan
program available to private financial institutions, pursuant to legislation in 2010. Prior periods have been adjusted to reflect this change.
The Wells Fargo Financial debt consolidation portfolio
included $1.1 billion of loans at December 31, 2011, that were
considered prime based on secondary market standards,
compared with $1.2 billion at December 31, 2010. The rest is
non-prime but was originated with underwriting standards to
reduce credit risk. Wells Fargo Financial ceased originating
loans and leases through its indirect auto business channel by
the end of 2008.
The home equity liquidating portfolio was designated in
fourth quarter 2007 from loans generated through third party
channels. This portfolio is discussed in more detail in the
“Credit Risk Management – Home Equity Portfolios” section of
this Report.
Information about the liquidating PCI and Pick-a-Pay loan
portfolios is provided in the discussion of loan portfolios that
follows.
47