Wells Fargo 2011 Annual Report Download - page 168
Download and view the complete annual report
Please find page 168 of the 2011 Wells Fargo annual report below. You can navigate through the pages in the report by either clicking on the pages listed below, or by using the keyword search tool below to find specific information within the annual report.-
 1
1 -
2
-
3
-
4
-
5
-
6
-
7
-
8
-
9
-
10
-
11
-
12
-
13
-
14
-
15
-
16
-
17
-
18
-
19
-
20
-
21
-
22
-
23
-
24
-
25
-
26
-
27
-
28
-
29
-
30
-
31
-
32
-
33
-
34
-
35
-
36
-
37
-
38
-
39
-
40
-
41
-
42
-
43
-
44
-
45
-
46
-
47
-
48
-
49
-
50
-
51
-
52
-
53
-
54
-
55
-
56
-
57
-
58
-
59
-
60
-
61
-
62
-
63
-
64
-
65
-
66
-
67
-
68
-
69
-
70
-
71
-
72
-
73
-
74
-
75
-
76
-
77
-
78
-
79
-
80
-
81
-
82
-
83
-
84
-
85
-
86
-
87
-
88
-
89
-
90
-
91
-
92
-
93
-
94
-
95
-
96
-
97
-
98
-
99
-
100
-
101
-
102
-
103
-
104
-
105
-
106
-
107
-
108
-
109
-
110
-
111
-
112
-
113
-
114
-
115
-
116
-
117
-
118
-
119
-
120
-
121
-
122
-
123
-
124
-
125
-
126
-
127
-
128
-
129
-
130
-
131
-
132
-
133
-
134
-
135
-
136
-
137
-
138
-
139
-
140
-
141
-
142
-
143
-
144
-
145
-
146
-
147
-
148
-
149
-
150
-
151
-
152
-
153
-
154
-
155
-
156
-
157
-
 158
158 -
 159
159 -
 160
160 -
 161
161 -
 162
162 -
 163
163 -
 164
164 -
 165
165 -
 166
166 -
 167
167 -
 168
168 -
 169
169 -
 170
170 -
 171
171 -
 172
172 -
 173
173 -
 174
174 -
 175
175 -
 176
176 -
 177
177 -
 178
178 -
179
-
180
-
181
-
182
-
183
-
184
-
185
-
186
-
187
-
188
-
189
-
190
-
191
-
192
-
193
-
194
-
195
-
196
-
197
-
198
-
199
-
200
-
201
-
202
-
203
-
204
-
205
-
206
-
207
-
208
-
209
-
210
-
211
-
212
-
213
-
214
-
215
-
216
-
217
-
218
-
219
-
220
-
221
-
222
-
223
-
224
-
225
-
226
-
227
-
228
-
229
-
230
-
231
-
232
-
233
-
234
-
235
-
236
-
237
-
238
-
239
-
240
 |
 |

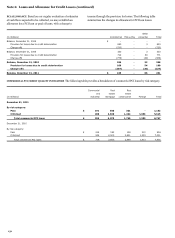
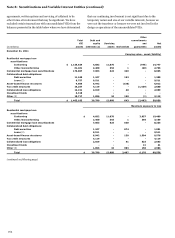
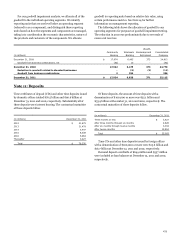
Note 8: Securitizations and Variable Interest Entities (continued)
Securitization Activity Related to Unconsolidated
VIEs
We use VIEs to securitize consumer and CRE loans and other
types of financial assets, including student loans and auto loans.
We typically retain the servicing rights from these sales and may
continue to hold other beneficial interests in the VIEs. We may
also provide liquidity to investors in the beneficial interests and
credit enhancements in the form of standby letters of credit.
Through these securitizations we may be exposed to liability
under limited amounts of recourse as well as standard
representations and warranties we make to purchasers and
issuers.
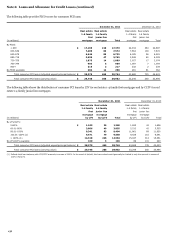
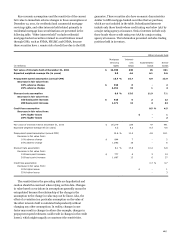
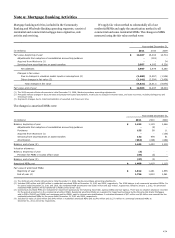
In 2011, 2010, and 2009, we recognized net gains of
$112 million, $27 million, and $1 million, respectively, from
transfers accounted for as sales of financial assets in
securitizations. Additionally, we had the following cash flows
with our securitization trusts that were involved in transfers
accounted for as sales.
Year ended December 31,
2011
2010
2009
Other
Other
Other
Mortgage
financial
Mortgage
financial
Mortgage
financial
(in millions)
loans
assets
loans
assets
loans
assets
Sales proceeds from securitizations (1)
$
337,357
-
374,488
-
394,632
-
Servicing fees
4,401
11
4,316
34
4,283
42
Other interests held
1,779
263
1,786
442
3,757
310
Purchases of delinquent assets
9
-
25
-
45
-
Net servicing advances
29
-
49
-
257
-
(1) Represents cash flow data for all loans securitized in the period presented.
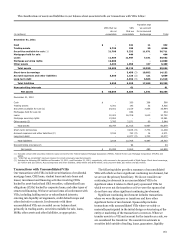
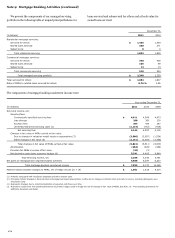
Sales with continuing involvement during 2011 and 2010
predominantly related to conforming residential mortgage
securitizations. During 2011 and 2010, we transferred
$329.1 billion and $379.0 billion, respectively, in fair value of
conforming residential mortgages to unconsolidated VIEs and
recorded the transfers as sales. These transfers did not result in a
gain or loss because the loans are already carried at fair value. In
connection with these transfers, in 2011 we recorded a
$4.0 billion servicing asset, measured at fair value using a Level
3 measurement technique, and a $101 million liability for
probable repurchase losses. In 2010, we recorded a $4.5 billion
servicing asset, with $4.1 billion recorded at fair value as Level 3
and the remaining $400 million recorded as amortized mortgage
servicing rights. We also recorded a $144 million repurchase
liability in 2010.
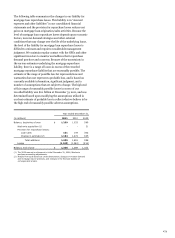
We used the following key weighted-average assumptions to
measure mortgage servicing assets at the date of securitization:
Mortgage servicing rights
2011
2010
Prepayment speed (annual CPR (1))
12.8
%
13.5
Life (in years)
5.9
5.4
Discount rate
7.7
%
8.0
(1) Constant prepayment rate.
166