Wells Fargo 2011 Annual Report Download - page 176
Download and view the complete annual report
Please find page 176 of the 2011 Wells Fargo annual report below. You can navigate through the pages in the report by either clicking on the pages listed below, or by using the keyword search tool below to find specific information within the annual report.-
 1
1 -
2
-
3
-
4
-
5
-
6
-
7
-
8
-
9
-
10
-
11
-
12
-
13
-
14
-
15
-
16
-
17
-
18
-
19
-
20
-
21
-
22
-
23
-
24
-
25
-
26
-
27
-
28
-
29
-
30
-
31
-
32
-
33
-
34
-
35
-
36
-
37
-
38
-
39
-
40
-
41
-
42
-
43
-
44
-
45
-
46
-
47
-
48
-
49
-
50
-
51
-
52
-
53
-
54
-
55
-
56
-
57
-
58
-
59
-
60
-
61
-
62
-
63
-
64
-
65
-
66
-
67
-
68
-
69
-
70
-
71
-
72
-
73
-
74
-
75
-
76
-
77
-
78
-
79
-
80
-
81
-
82
-
83
-
84
-
85
-
86
-
87
-
88
-
89
-
90
-
91
-
92
-
93
-
94
-
95
-
96
-
97
-
98
-
99
-
100
-
101
-
102
-
103
-
104
-
105
-
106
-
107
-
108
-
109
-
110
-
111
-
112
-
113
-
114
-
115
-
116
-
117
-
118
-
119
-
120
-
121
-
122
-
123
-
124
-
125
-
126
-
127
-
128
-
129
-
130
-
131
-
132
-
133
-
134
-
135
-
136
-
137
-
138
-
139
-
140
-
141
-
142
-
143
-
144
-
145
-
146
-
147
-
148
-
149
-
150
-
151
-
152
-
153
-
154
-
155
-
156
-
157
-
158
-
159
-
160
-
161
-
162
-
163
-
164
-
165
-
 166
166 -
 167
167 -
 168
168 -
 169
169 -
 170
170 -
 171
171 -
 172
172 -
 173
173 -
 174
174 -
 175
175 -
 176
176 -
 177
177 -
 178
178 -
 179
179 -
 180
180 -
 181
181 -
 182
182 -
 183
183 -
 184
184 -
 185
185 -
 186
186 -
187
-
188
-
189
-
190
-
191
-
192
-
193
-
194
-
195
-
196
-
197
-
198
-
199
-
200
-
201
-
202
-
203
-
204
-
205
-
206
-
207
-
208
-
209
-
210
-
211
-
212
-
213
-
214
-
215
-
216
-
217
-
218
-
219
-
220
-
221
-
222
-
223
-
224
-
225
-
226
-
227
-
228
-
229
-
230
-
231
-
232
-
233
-
234
-
235
-
236
-
237
-
238
-
239
-
240
 |
 |
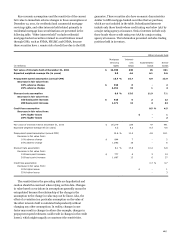
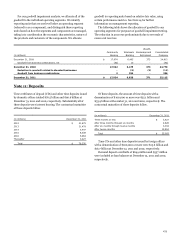
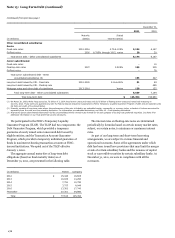
Note 10: Intangible Assets
The gross carrying value of intangible assets and accumulated amortization was:
December 31,
2011
2010
Gross
Net
Gross
Net
carrying
Accumulated
carrying
carrying
Accumulated
carrying
(in millions)
value
amortization
value
value
amortization
value
Amortized intangible assets (1):
MSRs (2)
$
2,383
(975)
1,408
2,131
(712)
1,419
Core deposit intangibles
15,079
(7,768)
7,311
15,133
(6,229)
8,904
Customer relationship and other intangibles
3,158
(1,519)
1,639
3,077
(1,230)
1,847
Total amortized intangible assets
$
20,620
(10,262)
10,358
20,341
(8,171)
12,170
Unamortized intangible assets:
MSRs (carried at fair value) (2)
$
12,603
14,467
Goodwill
25,115
24,770
Trademark
14
14
(1) Excludes fully amortized intangible assets.
(2) See Note 9 for additional information on MSRs.
We based our projections of amortization expense shown
below on existing asset balances at December 31, 2011, with the
exception of a portfolio of MSRs with a net carrying value of
$313 million. Effective January 1, 2012, this portfolio of MSRs
will be transferring to MSRs carried at fair value. Future
amortization expense may vary from these projections.
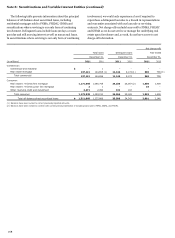
The following table provides the current year and estimated
future amortization expense for amortized intangible assets.
Customer
Core
relationship
Amortized
deposit
and other
(in millions)
MSRs
intangibles
intangibles
Total
Year ended December 31, 2011 (actual)
$
264
1,594
294
2,152
Estimate for year ended December 31,
2012
$
226
1,396
283
1,905
2013
194
1,241
260
1,695
2014
165
1,113
245
1,523
2015
149
1,022
221
1,392
2016
110
919
209
1,238
174