Wells Fargo 2011 Annual Report Download - page 59
Download and view the complete annual report
Please find page 59 of the 2011 Wells Fargo annual report below. You can navigate through the pages in the report by either clicking on the pages listed below, or by using the keyword search tool below to find specific information within the annual report.-
 1
1 -
2
-
3
-
4
-
5
-
6
-
7
-
8
-
9
-
10
-
11
-
12
-
13
-
14
-
15
-
16
-
17
-
18
-
19
-
20
-
21
-
22
-
23
-
24
-
25
-
26
-
27
-
28
-
29
-
30
-
31
-
32
-
33
-
34
-
35
-
36
-
37
-
38
-
39
-
40
-
41
-
42
-
43
-
44
-
45
-
46
-
47
-
48
-
 49
49 -
 50
50 -
 51
51 -
 52
52 -
 53
53 -
 54
54 -
 55
55 -
 56
56 -
 57
57 -
 58
58 -
 59
59 -
 60
60 -
 61
61 -
 62
62 -
 63
63 -
 64
64 -
 65
65 -
 66
66 -
 67
67 -
 68
68 -
 69
69 -
70
-
71
-
72
-
73
-
74
-
75
-
76
-
77
-
78
-
79
-
80
-
81
-
82
-
83
-
84
-
85
-
86
-
87
-
88
-
89
-
90
-
91
-
92
-
93
-
94
-
95
-
96
-
97
-
98
-
99
-
100
-
101
-
102
-
103
-
104
-
105
-
106
-
107
-
108
-
109
-
110
-
111
-
112
-
113
-
114
-
115
-
116
-
117
-
118
-
119
-
120
-
121
-
122
-
123
-
124
-
125
-
126
-
127
-
128
-
129
-
130
-
131
-
132
-
133
-
134
-
135
-
136
-
137
-
138
-
139
-
140
-
141
-
142
-
143
-
144
-
145
-
146
-
147
-
148
-
149
-
150
-
151
-
152
-
153
-
154
-
155
-
156
-
157
-
158
-
159
-
160
-
161
-
162
-
163
-
164
-
165
-
166
-
167
-
168
-
169
-
170
-
171
-
172
-
173
-
174
-
175
-
176
-
177
-
178
-
179
-
180
-
181
-
182
-
183
-
184
-
185
-
186
-
187
-
188
-
189
-
190
-
191
-
192
-
193
-
194
-
195
-
196
-
197
-
198
-
199
-
200
-
201
-
202
-
203
-
204
-
205
-
206
-
207
-
208
-
209
-
210
-
211
-
212
-
213
-
214
-
215
-
216
-
217
-
218
-
219
-
220
-
221
-
222
-
223
-
224
-
225
-
226
-
227
-
228
-
229
-
230
-
231
-
232
-
233
-
234
-
235
-
236
-
237
-
238
-
239
-
240
 |
 |

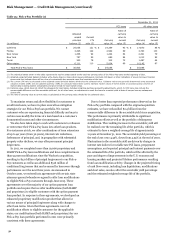
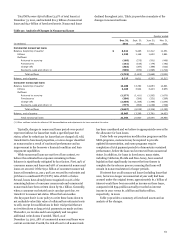
HOME EQUITY PORTFOLIOS
Our home equity portfolios
consist
of real estate 1-4 family junior lien mortgages and first and
junior lines of credit secured by real estate. Our first lien lines of
credit represent 20% of our home equity portfolio and are
included in real estate 1-4 family first mortgages. The majority of
our junior lien loan products are amortizing payment loans with
fixed interest rates and repayment periods between 5 to 30
years. Junior lien loans with balloon payments at the end of the
repayment term represent a small portion of our junior lien
loans.
Our first and junior lien lines of credit products generally
have a draw period of 10 years with variable interest rates and
payment options during the draw period of (1) interest only or
(2) 1.5% of total outstanding balance. During the draw period,
the borrower has the option of converting all or a portion of the
line from a variable interest rate to a fixed rate with terms
including interest-only payments for a fixed period between
three to seven years or a fully amortizing payment with a fixed
period between five to 30 years. At the end of the draw period, a
line of credit generally converts to an amortizing payment loan
with repayment terms of up to 30 years based on the balance at
time of conversion. The draw periods for a majority of our lines
of credit end after 2015.
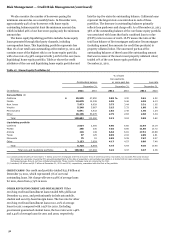
We continuously monitor the credit performance of our
junior lien mortgage portfolio for trends and factors that
influence the frequency and severity of loss. We have observed
that the severity of loss for junior lien mortgages is high and
generally not affected by whether we or a third party own or
service the related first mortgage, but that the frequency of loss
is lower when we own or service the first mortgage. In general,
we have limited information available on the delinquency status
of the third party owned or serviced senior lien where we also
have a junior lien. To capture this inherent loss content, we use
the experience of our junior lien mortgages behind delinquent
first liens that are owned or serviced by us adjusted for observed
higher delinquency rates associated with junior lien mortgages
behind third party first mortgages. We incorporate this inherent
loss content into our allowance for loan losses. During 2011 we
refined our allowance process for junior liens to ensure
appropriate consideration of the relative difference in loss
experience for junior liens behind first lien mortgage loans we
own or service, compared with those behind first lien mortgage
loans owned or serviced by third parties. In addition, we refined
our allowance process for junior liens that are current, but are in
their revolving period, to more appropriately reflect the inherent
loss where the borrower is delinquent on the corresponding first
lien mortgage loans. The impact of these revisions was not
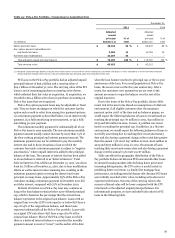
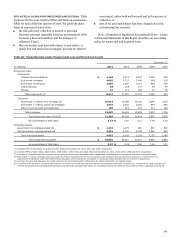
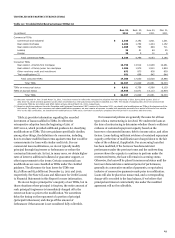
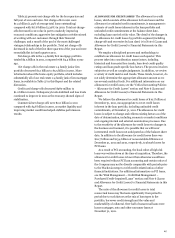
significant to our allowance. Table 26 summarizes delinquency
and loss rates by the holder of the lien.
Table 26: Home Equity Portfolios Performance by Holder of 1st Lien (1)(2)
% of loans
Loss rate
two payments
(annualized)
Outstanding balance
or more past due
quarter ended
Dec. 31,
Sept. 30,
June 30,
Dec. 31,
Sept. 30,
June 30,
Dec. 31,
Sept. 30,
June 30,
(in millions)
2011
2011
2011
2011
2011
2011
2011
2011
2011
First lien lines
$
20,786
21,011
20,941
3.10
%
3.00
2.85
0.95
0.91
0.82
Junior lien mortgages and lines behind:
Wells Fargo owned or serviced
first lien
42,810
44,403
44,963
2.91
2.83
2.78
3.48
3.43
3.76
Third party first lien
42,996
43,668
44,779
3.59
3.58
3.53
3.83
4.11
4.32
Total
$
106,592
109,082
110,683
3.22
3.16
3.09
3.13
3.22
3.43
(1)
Excludes PCI loans and real estate 1-4 family first lien line reverse mortgages added to the consumer portfolio in fourth quarter 2011 as a result of consolidating reverse
mortgage loans previously sold. These reverse mortgage loans are insured by the FHA.
(2)
Includes $1.5 billion, $1.5 billion and $1.6 billion at December 31, September 30 and June 30, 2011, respectively, associated with the Pick-a-Pay portfolio.
57