Wells Fargo 2011 Annual Report Download - page 70
Download and view the complete annual report
Please find page 70 of the 2011 Wells Fargo annual report below. You can navigate through the pages in the report by either clicking on the pages listed below, or by using the keyword search tool below to find specific information within the annual report.-
 1
1 -
2
-
3
-
4
-
5
-
6
-
7
-
8
-
9
-
10
-
11
-
12
-
13
-
14
-
15
-
16
-
17
-
18
-
19
-
20
-
21
-
22
-
23
-
24
-
25
-
26
-
27
-
28
-
29
-
30
-
31
-
32
-
33
-
34
-
35
-
36
-
37
-
38
-
39
-
40
-
41
-
42
-
43
-
44
-
45
-
46
-
47
-
48
-
49
-
50
-
51
-
52
-
53
-
54
-
55
-
56
-
57
-
58
-
59
-
 60
60 -
 61
61 -
 62
62 -
 63
63 -
 64
64 -
 65
65 -
 66
66 -
 67
67 -
 68
68 -
 69
69 -
 70
70 -
 71
71 -
 72
72 -
 73
73 -
 74
74 -
 75
75 -
 76
76 -
 77
77 -
 78
78 -
 79
79 -
 80
80 -
81
-
82
-
83
-
84
-
85
-
86
-
87
-
88
-
89
-
90
-
91
-
92
-
93
-
94
-
95
-
96
-
97
-
98
-
99
-
100
-
101
-
102
-
103
-
104
-
105
-
106
-
107
-
108
-
109
-
110
-
111
-
112
-
113
-
114
-
115
-
116
-
117
-
118
-
119
-
120
-
121
-
122
-
123
-
124
-
125
-
126
-
127
-
128
-
129
-
130
-
131
-
132
-
133
-
134
-
135
-
136
-
137
-
138
-
139
-
140
-
141
-
142
-
143
-
144
-
145
-
146
-
147
-
148
-
149
-
150
-
151
-
152
-
153
-
154
-
155
-
156
-
157
-
158
-
159
-
160
-
161
-
162
-
163
-
164
-
165
-
166
-
167
-
168
-
169
-
170
-
171
-
172
-
173
-
174
-
175
-
176
-
177
-
178
-
179
-
180
-
181
-
182
-
183
-
184
-
185
-
186
-
187
-
188
-
189
-
190
-
191
-
192
-
193
-
194
-
195
-
196
-
197
-
198
-
199
-
200
-
201
-
202
-
203
-
204
-
205
-
206
-
207
-
208
-
209
-
210
-
211
-
212
-
213
-
214
-
215
-
216
-
217
-
218
-
219
-
220
-
221
-
222
-
223
-
224
-
225
-
226
-
227
-
228
-
229
-
230
-
231
-
232
-
233
-
234
-
235
-
236
-
237
-
238
-
239
-
240
 |
 |
Risk Management — Credit Risk Management (continued)
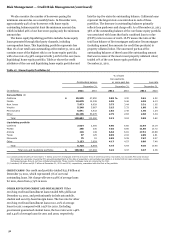
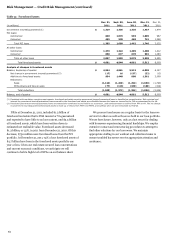
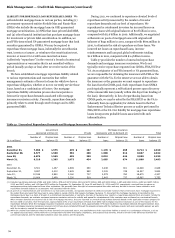
The $3.7 billion decline in the allowance for loan losses in
2011 reflected the release of allowance due to lower levels of
inherent credit loss in the portfolio compared with prior year-
end levels. Total provision for credit losses was $7.9 billion in
2011, $15.8 billion in 2010 and $21.7 billion in 2009. The 2011
provision was $3.4 billion less than net charge-offs. Primary
drivers of the 2011 provision reduction were decreased net
charge-offs and continued improvement in the credit quality of
the commercial and consumer portfolios and related loss
estimates as seen in declining delinquency and nonperforming
loan levels. Absent significant deterioration in the economy, we
expect future allowance releases in 2012, although at more
modest levels.
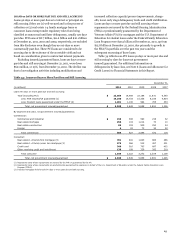
In 2010, the provision of $15.8 billion was $2.0 billion less
than net charge-offs. The reduction in the provision was
primarily due to continued improvement in the consumer
portfolios and related loss estimates and improvement in
economic conditions. These drivers were partially offset by an
increase in impaired loans and related allowance primarily
associated with increased consumer loan modification efforts
and a $693 million addition to the allowance due to adoption of
consolidation accounting guidance on January 1, 2010.
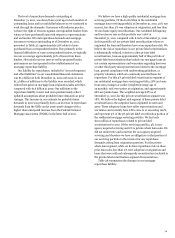
In 2009, the provision of $21.7 billion was $3.5 billion
greater than net charge-offs. Primary drivers of the 2009
provision were deterioration in economic conditions that
increased the projected losses in our commercial portfolios,
additional allowance associated with loan modification
programs designed to keep qualifying borrowers in their homes,
and the establishment of additional allowance for PCI loans.
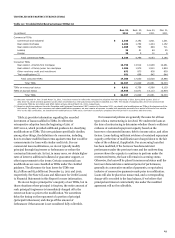
In determining the appropriate allowance attributable to our
residential real estate portfolios, the loss rates used in our
analysis include the impact of our established loan modification
programs. When modifications occur or are probable to occur,
our allowance considers the impact of these modifications,
taking into consideration the associated credit cost, including re-
defaults of modified loans and projected loss severity. The loss
content associated with existing and probable loan modifications
has been considered in our allowance reserving methodology.
Changes in the allowance reflect changes in statistically
derived loss estimates, historical loss experience, current trends
in borrower risk and/or general economic activity on portfolio
performance, and management’s estimate for imprecision and
uncertainty, including ongoing discussions with regulatory and
government agencies regarding mortgage foreclosure-related
matters.
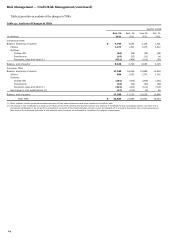
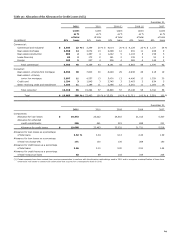
Table 36 presents an analysis of the allowance for credit
losses by loan segments and classes for the last five years.
68