Wells Fargo 2011 Annual Report Download - page 57
Download and view the complete annual report
Please find page 57 of the 2011 Wells Fargo annual report below. You can navigate through the pages in the report by either clicking on the pages listed below, or by using the keyword search tool below to find specific information within the annual report.-
 1
1 -
2
-
3
-
4
-
5
-
6
-
7
-
8
-
9
-
10
-
11
-
12
-
13
-
14
-
15
-
16
-
17
-
18
-
19
-
20
-
21
-
22
-
23
-
24
-
25
-
26
-
27
-
28
-
29
-
30
-
31
-
32
-
33
-
34
-
35
-
36
-
37
-
38
-
39
-
40
-
41
-
42
-
43
-
44
-
45
-
46
-
 47
47 -
 48
48 -
 49
49 -
 50
50 -
 51
51 -
 52
52 -
 53
53 -
 54
54 -
 55
55 -
 56
56 -
 57
57 -
 58
58 -
 59
59 -
 60
60 -
 61
61 -
 62
62 -
 63
63 -
 64
64 -
 65
65 -
 66
66 -
 67
67 -
68
-
69
-
70
-
71
-
72
-
73
-
74
-
75
-
76
-
77
-
78
-
79
-
80
-
81
-
82
-
83
-
84
-
85
-
86
-
87
-
88
-
89
-
90
-
91
-
92
-
93
-
94
-
95
-
96
-
97
-
98
-
99
-
100
-
101
-
102
-
103
-
104
-
105
-
106
-
107
-
108
-
109
-
110
-
111
-
112
-
113
-
114
-
115
-
116
-
117
-
118
-
119
-
120
-
121
-
122
-
123
-
124
-
125
-
126
-
127
-
128
-
129
-
130
-
131
-
132
-
133
-
134
-
135
-
136
-
137
-
138
-
139
-
140
-
141
-
142
-
143
-
144
-
145
-
146
-
147
-
148
-
149
-
150
-
151
-
152
-
153
-
154
-
155
-
156
-
157
-
158
-
159
-
160
-
161
-
162
-
163
-
164
-
165
-
166
-
167
-
168
-
169
-
170
-
171
-
172
-
173
-
174
-
175
-
176
-
177
-
178
-
179
-
180
-
181
-
182
-
183
-
184
-
185
-
186
-
187
-
188
-
189
-
190
-
191
-
192
-
193
-
194
-
195
-
196
-
197
-
198
-
199
-
200
-
201
-
202
-
203
-
204
-
205
-
206
-
207
-
208
-
209
-
210
-
211
-
212
-
213
-
214
-
215
-
216
-
217
-
218
-
219
-
220
-
221
-
222
-
223
-
224
-
225
-
226
-
227
-
228
-
229
-
230
-
231
-
232
-
233
-
234
-
235
-
236
-
237
-
238
-
239
-
240
 |
 |

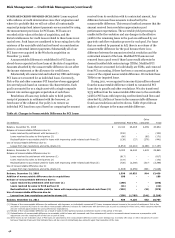
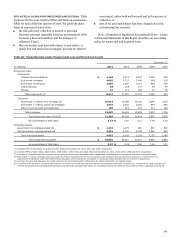
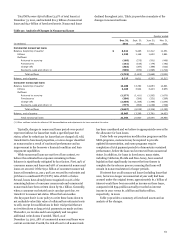
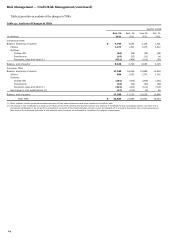
Table 24: Pick-a-Pay Portfolio - Comparison to Acquisition Date
December 31,
2011
2008
Adjusted
Adjusted
unpaid
unpaid
principal
% of
principal
% of
(in millions)
balance (1)
total
balance (1)
total
Option payment loans
$
39,164
53
%
$
99,937
86
%
Non-option payment adjustable-rate
and fixed-rate loans
9,986
14
15,763
14
Full-term loan modifications
24,207
33
-
-
Total adjusted unpaid principal balance
$
73,357
100
%
$
115,700
100
%
Total carrying value
$
65,652
$
95,315
(1)
Adjusted unpaid principal balance includes write-downs taken on loans where severe delinquency (normally 180 days) or other indications of severe borrower financial
stress exist that indicate there will be a loss of contractually due amounts upon final resolution of the loan.
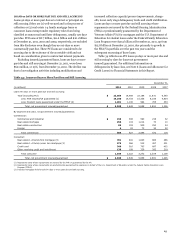
PCI loans in the Pick-a-Pay portfolio had an adjusted unpaid
principal balance of $36.9 billion and a carrying value of
$29.1 billion at December 31, 2011. The carrying value of the PCI
loans is net of remaining purchase accounting write-downs,
which reflected their fair value at acquisition. At acquisition, we
recorded a $22.4 billion write-down in purchase accounting on
Pick-a-Pay loans that were impaired.
Pick-a-Pay option payment loans may be adjustable or fixed
rate. They are home mortgages on which the customer has the
option each month to select from among four payment options:
(1) a minimum payment as described below, (2) an interest-only
payment, (3) a fully amortizing 15-year payment, or (4) a fully
amortizing 30-year payment.
The minimum monthly payment for substantially all of our
Pick-a-Pay loans is reset annually. The new minimum monthly
payment amount usually cannot increase by more than 7.5% of
the then-existing principal and interest payment amount. The
minimum payment may not be sufficient to pay the monthly
interest due and in those situations a loan on which the
customer has made a minimum payment is subject to “negative
amortization,” where unpaid interest is added to the principal
balance of the loan. The amount of interest that has been added
to a loan balance is referred to as “deferred interest.” Total
deferred interest of $2.0 billion at December 31, 2011, was down
from $2.7 billion at December 31, 2010, due to loan modification
efforts as well as interest rates remaining low, resulting in the
minimum payment option covering the interest and some
principal on many loans. Approximately 83% of the Pick-a-Pay
customers making a minimum payment in December 2011 did
not defer interest, compared with 75% in December 2010.
Deferral of interest on a Pick-a-Pay loan may continue as
long as the loan balance remains below a pre-defined principal
cap, which is based on the percentage that the current loan
balance represents to the original loan balance. Loans with an
original loan-to-value (LTV) ratio equal to or below 85% have a
cap of 125% of the original loan balance, and these loans
represent substantially all the Pick-a-Pay portfolio. Loans with
an original LTV ratio above 85% have a cap of 110% of the
original loan balance. Most of the Pick-a-Pay loans on which
there is a deferred interest balance re-amortize (the monthly
payment amount is reset or “recast”) on the earlier of the date
when the loan balance reaches its principal cap, or the 10-year
anniversary of the loan. For a small population of Pick-a-Pay
loans, the recast occurs at the five-year anniversary. After a
recast, the customers’ new payment terms are reset to the
amount necessary to repay the balance over the rest of the
original loan term.
Due to the terms of the Pick-a-Pay portfolio, there is little
recast risk in the near term. Based on assumptions of a flat rate
environment, if all eligible customers elect the minimum
payment option 100% of the time and no balances prepay, we
would expect the following balances of loans to recast based on
reaching the principal cap: $7 million in 2012, $22 million in
2013 and $81 million in 2014. In 2011, $3 million was recast
based on reaching the principal cap. In addition, in a flat rate
environment, we would expect the following balances of loans to
start fully amortizing due to reaching their recast anniversary
date and also having a payment change at the recast date greater
than the annual 7.5% reset: $47 million in 2012, $100 million in
2013 and $373 million in 2014. In 2011, the amount of loans
reaching their recast anniversary date and also having a payment
change over the annual 7.5% reset was $7 million.
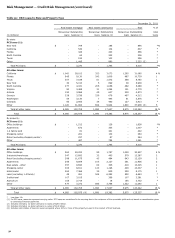
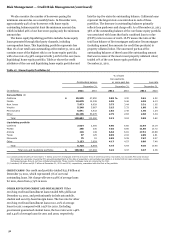
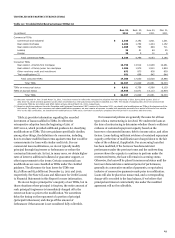
Table 25 reflects the geographic distribution of the Pick-a-
Pay portfolio broken out between PCI loans and all other loans.
In stressed housing markets with declining home prices and
increasing delinquencies, the LTV ratio is a useful metric in
predicting future real estate 1-4 family first mortgage loan
performance, including potential charge-offs. Because PCI loans
were initially recorded at fair value, including write-downs for
expected credit losses, the ratio of the carrying value to the
current collateral value will be lower compared with the LTV
ratio based on the adjusted unpaid principal balance. For
informational purposes, we have included both ratios for PCI
loans in the following table.
55