Wells Fargo 2011 Annual Report Download - page 149
Download and view the complete annual report
Please find page 149 of the 2011 Wells Fargo annual report below. You can navigate through the pages in the report by either clicking on the pages listed below, or by using the keyword search tool below to find specific information within the annual report.-
 1
1 -
2
-
3
-
4
-
5
-
6
-
7
-
8
-
9
-
10
-
11
-
12
-
13
-
14
-
15
-
16
-
17
-
18
-
19
-
20
-
21
-
22
-
23
-
24
-
25
-
26
-
27
-
28
-
29
-
30
-
31
-
32
-
33
-
34
-
35
-
36
-
37
-
38
-
39
-
40
-
41
-
42
-
43
-
44
-
45
-
46
-
47
-
48
-
49
-
50
-
51
-
52
-
53
-
54
-
55
-
56
-
57
-
58
-
59
-
60
-
61
-
62
-
63
-
64
-
65
-
66
-
67
-
68
-
69
-
70
-
71
-
72
-
73
-
74
-
75
-
76
-
77
-
78
-
79
-
80
-
81
-
82
-
83
-
84
-
85
-
86
-
87
-
88
-
89
-
90
-
91
-
92
-
93
-
94
-
95
-
96
-
97
-
98
-
99
-
100
-
101
-
102
-
103
-
104
-
105
-
106
-
107
-
108
-
109
-
110
-
111
-
112
-
113
-
114
-
115
-
116
-
117
-
118
-
119
-
120
-
121
-
122
-
123
-
124
-
125
-
126
-
127
-
128
-
129
-
130
-
131
-
132
-
133
-
134
-
135
-
136
-
137
-
138
-
 139
139 -
 140
140 -
 141
141 -
 142
142 -
 143
143 -
 144
144 -
 145
145 -
 146
146 -
 147
147 -
 148
148 -
 149
149 -
 150
150 -
 151
151 -
 152
152 -
 153
153 -
 154
154 -
 155
155 -
 156
156 -
 157
157 -
 158
158 -
 159
159 -
160
-
161
-
162
-
163
-
164
-
165
-
166
-
167
-
168
-
169
-
170
-
171
-
172
-
173
-
174
-
175
-
176
-
177
-
178
-
179
-
180
-
181
-
182
-
183
-
184
-
185
-
186
-
187
-
188
-
189
-
190
-
191
-
192
-
193
-
194
-
195
-
196
-
197
-
198
-
199
-
200
-
201
-
202
-
203
-
204
-
205
-
206
-
207
-
208
-
209
-
210
-
211
-
212
-
213
-
214
-
215
-
216
-
217
-
218
-
219
-
220
-
221
-
222
-
223
-
224
-
225
-
226
-
227
-
228
-
229
-
230
-
231
-
232
-
233
-
234
-
235
-
236
-
237
-
238
-
239
-
240
 |
 |

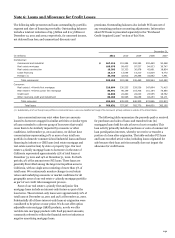
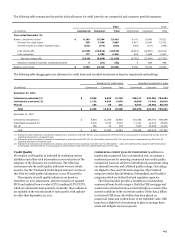
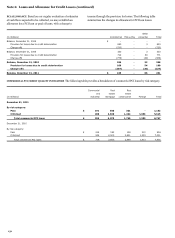
The following table provides the outstanding balances of our consumer portfolio by delinquency status.
Real estate
Real estate
Other
1-4 family
1-4 family
revolving
first
junior lien
Credit
credit and
(in millions)
mortgage
mortgage
card
installment
Total
December 31, 2011
By delinquency status:
Current-29 DPD
$
156,985
83,033
22,125
69,712
331,855
30-59 DPD
4,075
786
211
963
6,035
60-89 DPD
2,012
501
154
275
2,942
90-119 DPD
1,152
382
135
127
1,796
120-179 DPD
1,704
537
211
33
2,485
180+ DPD
6,665
546
-
4
7,215
Government insured/guaranteed loans (1)
26,555
-
-
15,346
41,901
Total consumer loans (excluding PCI)
199,148
85,785
22,836
86,460
394,229
Total consumer PCI loans (carrying value)
29,746
206
-
-
29,952
Total consumer loans
$
228,894
85,991
22,836
86,460
424,181
December 31, 2010 (2)
By delinquency status:
Current-29 DPD
$
164,558
92,512
21,276
67,129
345,475
30-59 DPD
4,516
917
262
1,261
6,956
60-89 DPD
2,173
608
207
376
3,364
90-119 DPD
1,399
476
190
171
2,236
120-179 DPD
2,080
764
324
58
3,226
180+ DPD
6,750
622
1
117
7,490
Government insured/guaranteed loans (1)
15,514
-
-
17,453
32,967
Total consumer loans (excluding PCI)
196,990
95,899
22,260
86,565
401,714
Total consumer PCI loans (carrying value)
33,245
250
-
-
33,495
Total consumer loans
$
230,235
96,149
22,260
86,565
435,209
(1) Represents loans whose repayments are insured by the FHA or guaranteed by the VA and student loans whose repayments are predominantly guaranteed by agencies on
behalf of the U.S. Department of Education under the Federal Family Education Loan Program (FFELP). In 2011, we consolidated $5.6 billion of previously sold FHA insured
real estate 1-4 family reverse mortgages.
(2) Amounts at December 31, 2010, have been revised to conform to the current separate presentation of government insured/guaranteed loans.
Of the $11.5 billion of loans that are 90 days or more past due
at December 31, 2011, $1.5 billion was accruing, compared with
$13.0 billion past due and $2.0 billion accruing at
December 31, 2010.
Real estate 1-4 family first mortgage loans 180 days or more
past due totaled $6.7 billion, or 3.3%, of total first mortgages
(excluding PCI), at December 31, 2011, compared with
$6.8 billion, or 3.4%, at December 31, 2010. The aging of the
delinquent real estate 1-4 family first mortgage loans is a result
of the prolonged foreclosure process and our effort to help
customers stay in their homes through various loan modification
programs, as loans continue to age until these processes are
complete.
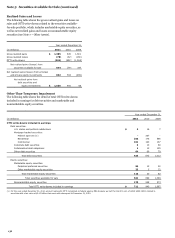
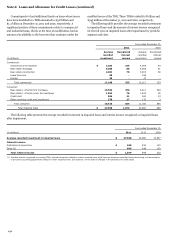
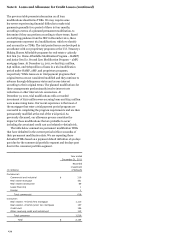
The following table provides a breakdown of our consumer
portfolio by updated FICO. We obtain FICO scores at loan
origination and the scores are updated at least quarterly. FICO is
not available for certain loan types. In addition, FICO may not be
obtained if we deem it unnecessary due to strong collateral and
other borrower attributes, primarily securities-based margin
loans of $5.0 billion and $4.1 billion at December 31, 2011 and
2010, respectively. The majority of our portfolio is underwritten
with a FICO score of 680 and above.
147