Wells Fargo 2011 Annual Report Download - page 36
Download and view the complete annual report
Please find page 36 of the 2011 Wells Fargo annual report below. You can navigate through the pages in the report by either clicking on the pages listed below, or by using the keyword search tool below to find specific information within the annual report.-
 1
1 -
2
-
3
-
4
-
5
-
6
-
7
-
8
-
9
-
10
-
11
-
12
-
13
-
14
-
15
-
16
-
17
-
18
-
19
-
20
-
21
-
22
-
23
-
24
-
25
-
 26
26 -
 27
27 -
 28
28 -
 29
29 -
 30
30 -
 31
31 -
 32
32 -
 33
33 -
 34
34 -
 35
35 -
 36
36 -
 37
37 -
 38
38 -
 39
39 -
 40
40 -
 41
41 -
 42
42 -
 43
43 -
 44
44 -
 45
45 -
 46
46 -
47
-
48
-
49
-
50
-
51
-
52
-
53
-
54
-
55
-
56
-
57
-
58
-
59
-
60
-
61
-
62
-
63
-
64
-
65
-
66
-
67
-
68
-
69
-
70
-
71
-
72
-
73
-
74
-
75
-
76
-
77
-
78
-
79
-
80
-
81
-
82
-
83
-
84
-
85
-
86
-
87
-
88
-
89
-
90
-
91
-
92
-
93
-
94
-
95
-
96
-
97
-
98
-
99
-
100
-
101
-
102
-
103
-
104
-
105
-
106
-
107
-
108
-
109
-
110
-
111
-
112
-
113
-
114
-
115
-
116
-
117
-
118
-
119
-
120
-
121
-
122
-
123
-
124
-
125
-
126
-
127
-
128
-
129
-
130
-
131
-
132
-
133
-
134
-
135
-
136
-
137
-
138
-
139
-
140
-
141
-
142
-
143
-
144
-
145
-
146
-
147
-
148
-
149
-
150
-
151
-
152
-
153
-
154
-
155
-
156
-
157
-
158
-
159
-
160
-
161
-
162
-
163
-
164
-
165
-
166
-
167
-
168
-
169
-
170
-
171
-
172
-
173
-
174
-
175
-
176
-
177
-
178
-
179
-
180
-
181
-
182
-
183
-
184
-
185
-
186
-
187
-
188
-
189
-
190
-
191
-
192
-
193
-
194
-
195
-
196
-
197
-
198
-
199
-
200
-
201
-
202
-
203
-
204
-
205
-
206
-
207
-
208
-
209
-
210
-
211
-
212
-
213
-
214
-
215
-
216
-
217
-
218
-
219
-
220
-
221
-
222
-
223
-
224
-
225
-
226
-
227
-
228
-
229
-
230
-
231
-
232
-
233
-
234
-
235
-
236
-
237
-
238
-
239
-
240
 |
 |

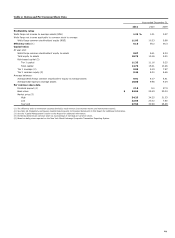
Earnings Performance (continued)
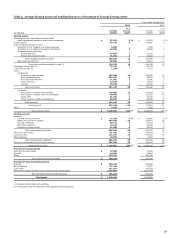
Table 5: Average Balances, Yields and Rates Paid (Taxable-Equivalent Basis) (1)(2)(3)
2011
2010
Interest
Interest
Average
Yields/
income/
Average
Yields/
income/
(in millions)
balance
rates
expense
balance
rates
expense
Earning assets
Federal funds sold, securities purchased under
resale agreements and other short-term investments
$
87,186
0.40
%
$
345
62,961
0.36
%
$
230
Trading assets
39,737
3.68
1,463
29,920
3.75
1,121
Securities available for sale (4):
Securities of U.S. Treasury and federal agencies
5,503
1.25
69
1,870
3.24
61
Securities of U.S. states and political subdivisions
24,035
5.09
1,223
16,089
6.09
980
Mortgage-backed securities:
Federal agencies
74,665
4.36
3,257
71,953
5.14
3,697
Residential and commercial
31,902
8.20
2,617
31,815
10.67
3,396
Total mortgage-backed securities
106,567
5.51
5,874
103,768
6.84
7,093
Other debt and equity securities
38,625
5.03
1,941
32,611
6.45
2,102
Total securities available for sale
174,730
5.21
9,107
154,338
6.63
10,236
Mortgages held for sale (5)
37,232
4.42
1,644
36,716
4.73
1,736
Loans held for sale (5)
1,104
5.25
58
3,773
2.67
101
Loans:
Commercial:
Commercial and industrial
157,608
4.37
6,894
149,576
4.80
7,186
Real estate mortgage
102,236
4.07
4,163
98,497
3.89
3,836
Real estate construction
21,592
4.88
1,055
31,286
3.36
1,051
Lease financing
12,944
7.54
976
13,451
9.21
1,239
Foreign
36,768
2.56
941
29,726
3.49
1,037
Total commercial
331,148
4.24
14,029
322,536
4.45
14,349
Consumer:
Real estate 1-4 family first mortgage
226,980
4.89
11,090
235,568
5.18
12,206
Real estate 1-4 family junior lien mortgage
90,705
4.33
3,926
101,537
4.45
4,519
Credit card
21,463
13.02
2,794
22,375
13.35
2,987
Other revolving credit and installment
86,848
6.29
5,463
88,585
6.49
5,747
Total consumer
425,996
5.46
23,273
448,065
5.68
25,459
Total loans (5)
757,144
4.93
37,302
770,601
5.17
39,808
Other
4,929
4.12
203
5,849
3.56
207
Total earning assets
$
1,102,062
4.55
%
$
50,122
1,064,158
5.02
%
$
53,439
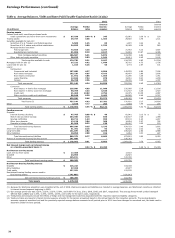
Funding sources
Deposits:
Interest-bearing checking
$
47,705
0.08
%
$
40
60,941
0.12
%
$
72
Market rate and other savings
464,450
0.18
836
416,877
0.26
1,088
Savings certificates
69,711
1.43
995
87,133
1.43
1,247
Other time deposits
13,126
2.04
268
14,654
2.07
302
Deposits in foreign offices
61,566
0.22
136
55,097
0.22
123
Total interest-bearing deposits
656,558
0.35
2,275
634,702
0.45
2,832
Short-term borrowings
51,781
0.18
94
46,824
0.22
106
Long-term debt
141,079
2.82
3,978
185,426
2.64
4,888
Other liabilities
10,955
2.88
316
6,863
3.31
227
Total interest-bearing liabilities
860,373
0.77
6,663
873,815
0.92
8,053
Portion of noninterest-bearing funding sources
241,689
-
-
190,343
-
-
Total funding sources
$
1,102,062
0.61
6,663
1,064,158
0.76
8,053
Net interest margin and net interest income
on a taxable-equivalent basis (6)
3.94
%
$
43,459
4.26
%
$
45,386
Noninterest-earning assets
Cash and due from banks
$
17,388
17,618
Goodwill
24,904
24,824
Other
125,911
120,338
Total noninterest-earning assets
$
168,203
162,780
Noninterest-bearing funding sources
Deposits
$
215,242
183,008
Other liabilities
57,399
47,877
Total equity
137,251
122,238
Noninterest-bearing funding sources used to
fund earning assets
(241,689)
(190,343)
Net noninterest-bearing funding sources
$
168,203
162,780
Total assets
$
1,270,265
1,226,938
(1) Because the Wachovia acquisition was completed at the end of 2008, Wachovia's assets and liabilities are included in average balances, and Wachovia's results are reflected
in interest income/expense beginning in 2009.
(2) Our average prime rate was 3.25%, 3.25%, 3.25%, 5.09%, and 8.05% for 2011, 2010, 2009, 2008, and 2007, respectively. The average three-month London Interbank
Offered Rate (LIBOR) was 0.34%, 0.34%, 0.69%, 2.93%, and 5.30% for the same years, respectively.
(3) Yields/rates and amounts include the effects of hedge and risk management activities associated with the respective asset and liability categories.
(4) Yields and rates are based on interest income/expense amounts for the period, annualized based on the accrual basis for the respective accounts. The average balance
amounts represent amortized cost and the previously reported average balance amounts for all periods prior to 2011 have been changed to amortized cost, the basis used to
determine yields for those periods.
34