Wells Fargo 2011 Annual Report Download - page 206
Download and view the complete annual report
Please find page 206 of the 2011 Wells Fargo annual report below. You can navigate through the pages in the report by either clicking on the pages listed below, or by using the keyword search tool below to find specific information within the annual report.-
 1
1 -
2
-
3
-
4
-
5
-
6
-
7
-
8
-
9
-
10
-
11
-
12
-
13
-
14
-
15
-
16
-
17
-
18
-
19
-
20
-
21
-
22
-
23
-
24
-
25
-
26
-
27
-
28
-
29
-
30
-
31
-
32
-
33
-
34
-
35
-
36
-
37
-
38
-
39
-
40
-
41
-
42
-
43
-
44
-
45
-
46
-
47
-
48
-
49
-
50
-
51
-
52
-
53
-
54
-
55
-
56
-
57
-
58
-
59
-
60
-
61
-
62
-
63
-
64
-
65
-
66
-
67
-
68
-
69
-
70
-
71
-
72
-
73
-
74
-
75
-
76
-
77
-
78
-
79
-
80
-
81
-
82
-
83
-
84
-
85
-
86
-
87
-
88
-
89
-
90
-
91
-
92
-
93
-
94
-
95
-
96
-
97
-
98
-
99
-
100
-
101
-
102
-
103
-
104
-
105
-
106
-
107
-
108
-
109
-
110
-
111
-
112
-
113
-
114
-
115
-
116
-
117
-
118
-
119
-
120
-
121
-
122
-
123
-
124
-
125
-
126
-
127
-
128
-
129
-
130
-
131
-
132
-
133
-
134
-
135
-
136
-
137
-
138
-
139
-
140
-
141
-
142
-
143
-
144
-
145
-
146
-
147
-
148
-
149
-
150
-
151
-
152
-
153
-
154
-
155
-
156
-
157
-
158
-
159
-
160
-
161
-
162
-
163
-
164
-
165
-
166
-
167
-
168
-
169
-
170
-
171
-
172
-
173
-
174
-
175
-
176
-
177
-
178
-
179
-
180
-
181
-
182
-
183
-
184
-
185
-
186
-
187
-
188
-
189
-
190
-
191
-
192
-
193
-
194
-
195
-
 196
196 -
 197
197 -
 198
198 -
 199
199 -
 200
200 -
 201
201 -
 202
202 -
 203
203 -
 204
204 -
 205
205 -
 206
206 -
 207
207 -
 208
208 -
 209
209 -
 210
210 -
 211
211 -
 212
212 -
 213
213 -
 214
214 -
 215
215 -
 216
216 -
217
-
218
-
219
-
220
-
221
-
222
-
223
-
224
-
225
-
226
-
227
-
228
-
229
-
230
-
231
-
232
-
233
-
234
-
235
-
236
-
237
-
238
-
239
-
240
 |
 |

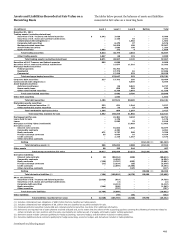
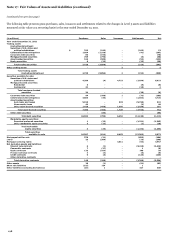
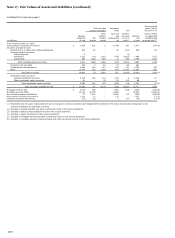
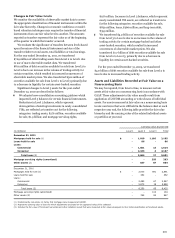
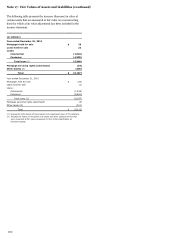
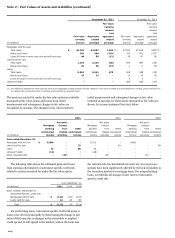
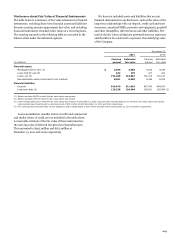
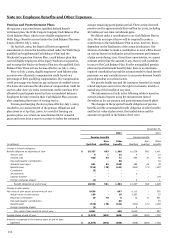
Note 17: Fair Values of Assets and Liabilities (continued)
December 31, 2011
December 31, 2010
Fair value
Fair value
carrying
carrying
amount
amount
less
less
Fair value
Aggregate
aggregate
Fair value
Aggregate
aggregate
carrying
unpaid
unpaid
carrying
unpaid
unpaid
(in millions)
amount
principal
principal
amount
principal
principal
Mortgages held for sale:
Total loans
$
44,791
43,687
1,104
(1)
47,531
47,818
(287)
(1)
Nonaccrual loans
265
584
(319)
325
662
(337)
Loans 90 days or more past due and still accruing
44
56
(12)
38
47
(9)
Loans held for sale:
Total loans
1,176
1,216
(40)
873
897
(24)
Nonaccrual loans
25
39
(14)
1
7
(6)
Loans:
Total loans
5,916
5,441
475
309
348
(39)
Nonaccrual loans
32
32
-
13
16
(3)
Loans 90 days or more past due and still accruing
-
-
-
2
2
-
Long-term debt
-
-
-
306
353
(47)
(1) The difference between fair value carrying amount and aggregate unpaid principal includes changes in fair value recorded at and subsequent to funding, gains and losses on
the related loan commitment prior to funding, and premiums on acquired loans.
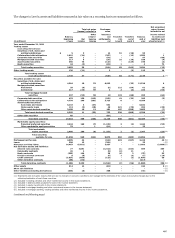
The assets accounted for under the fair value option are initially
measured at fair value. Gains and losses from initial
measurement and subsequent changes in fair value are
recognized in earnings. The changes in fair value related to
initial measurement and subsequent changes in fair value
included in earnings for these assets measured at fair value are
shown, by income statement line item, below.
2011
2010
2009
Net gains
Net gains
Net gains
Mortgage
(losses)
Mortgage
(losses)
Mortgage
(losses)
banking
from
Other
banking
from
Other
banking
from
Other
noninterest
trading
noninterest
noninterest
trading
noninterest
noninterest
trading
noninterest
(in millions)
income
activities
income
income
activities
income
income
activities
income
Year ended December 31,
Mortgages held for sale
$
6,084
-
-
6,512
-
-
4,891
-
-
Loans held for sale
-
-
32
-
-
24
-
-
99
Loans
13
-
80
55
-
-
-
-
-
Long-term debt
(11)
-
-
(48)
-
-
-
-
-
Other interests held
-
(25)
-
-
(13)
-
-
117
-
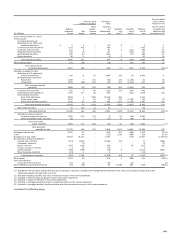
The following table shows the estimated gains and losses
from earnings attributable to instrument-specific credit risk
related to assets accounted for under the fair value option.
Year ended Dec. 31,
(in millions)
2011
2010
2009
Gains (losses) attributable to
instrument-specific credit risk:
Mortgages held for sale
$
(144)
(28)
(277)
Loans held for sale
32
24
63
Total
$
(112)
(4)
(214)
For performing loans, instrument-specific credit risk gains or
losses were derived principally by determining the change in fair
value of the loans due to changes in the observable or implied
credit spread. Credit spread is the market yield on the loans less
the relevant risk-free benchmark interest rate. In recent years
spreads have been significantly affected by the lack of liquidity in
the secondary market for mortgage loans. For nonperforming
loans, we attribute all changes in fair value to instrument-
specific credit risk.
204