Wells Fargo 2011 Annual Report Download - page 159
Download and view the complete annual report
Please find page 159 of the 2011 Wells Fargo annual report below. You can navigate through the pages in the report by either clicking on the pages listed below, or by using the keyword search tool below to find specific information within the annual report.-
 1
1 -
2
-
3
-
4
-
5
-
6
-
7
-
8
-
9
-
10
-
11
-
12
-
13
-
14
-
15
-
16
-
17
-
18
-
19
-
20
-
21
-
22
-
23
-
24
-
25
-
26
-
27
-
28
-
29
-
30
-
31
-
32
-
33
-
34
-
35
-
36
-
37
-
38
-
39
-
40
-
41
-
42
-
43
-
44
-
45
-
46
-
47
-
48
-
49
-
50
-
51
-
52
-
53
-
54
-
55
-
56
-
57
-
58
-
59
-
60
-
61
-
62
-
63
-
64
-
65
-
66
-
67
-
68
-
69
-
70
-
71
-
72
-
73
-
74
-
75
-
76
-
77
-
78
-
79
-
80
-
81
-
82
-
83
-
84
-
85
-
86
-
87
-
88
-
89
-
90
-
91
-
92
-
93
-
94
-
95
-
96
-
97
-
98
-
99
-
100
-
101
-
102
-
103
-
104
-
105
-
106
-
107
-
108
-
109
-
110
-
111
-
112
-
113
-
114
-
115
-
116
-
117
-
118
-
119
-
120
-
121
-
122
-
123
-
124
-
125
-
126
-
127
-
128
-
129
-
130
-
131
-
132
-
133
-
134
-
135
-
136
-
137
-
138
-
139
-
140
-
141
-
142
-
143
-
144
-
145
-
146
-
147
-
148
-
 149
149 -
 150
150 -
 151
151 -
 152
152 -
 153
153 -
 154
154 -
 155
155 -
 156
156 -
 157
157 -
 158
158 -
 159
159 -
 160
160 -
 161
161 -
 162
162 -
 163
163 -
 164
164 -
 165
165 -
 166
166 -
 167
167 -
 168
168 -
 169
169 -
170
-
171
-
172
-
173
-
174
-
175
-
176
-
177
-
178
-
179
-
180
-
181
-
182
-
183
-
184
-
185
-
186
-
187
-
188
-
189
-
190
-
191
-
192
-
193
-
194
-
195
-
196
-
197
-
198
-
199
-
200
-
201
-
202
-
203
-
204
-
205
-
206
-
207
-
208
-
209
-
210
-
211
-
212
-
213
-
214
-
215
-
216
-
217
-
218
-
219
-
220
-
221
-
222
-
223
-
224
-
225
-
226
-
227
-
228
-
229
-
230
-
231
-
232
-
233
-
234
-
235
-
236
-
237
-
238
-
239
-
240
 |
 |

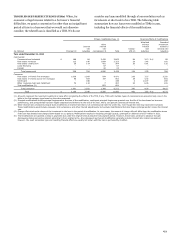
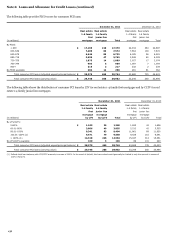
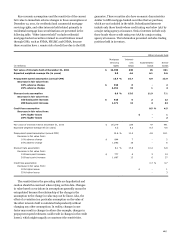
The following table provides past due information for commercial PCI loans.
Commercial
Real
Real
and
estate
estate
(in millions)
industrial
mortgage
construction
Foreign
Total
December 31, 2011
By delinquency status:
Current-29 DPD and still accruing
$
359
2,867
1,206
1,178
5,610
30-89 DPD and still accruing
22
178
72
-
272
90+ DPD and still accruing
18
225
467
175
885
Total commercial PCI loans
$
399
3,270
1,745
1,353
6,767
December 31, 2010
By delinquency status:
Current-29 DPD and still accruing
$
612
2,295
1,395
1,209
5,511
30-89 DPD and still accruing
22
113
178
-
313
90+ DPD and still accruing
84
447
1,376
204
2,111
Total commercial PCI loans
$
718
2,855
2,949
1,413
7,935
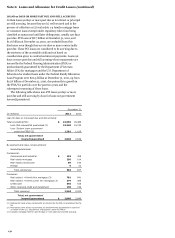
CONSUMER PCI CREDIT QUALITY INDICATORS
Our consumer
PCI loans were aggregated into several pools of loans at
acquisition. Below, we have provided credit quality indicators
based on the unpaid principal balance (adjusted for write-
downs) of the individual loans included in the pool, but we have
not allocated the remaining purchase accounting adjustments,
which were established at a pool level. The following table
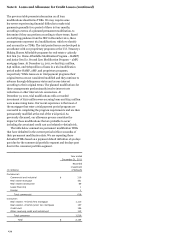
provides the delinquency status of consumer PCI loans.
December 31, 2011
December 31, 2010
Real estate
Real estate
Real estate
Real estate
1-4 family
1-4 family
1-4 family
1-4 family
first
junior lien
first
junior lien
(in millions)
mortgage
mortgage
Total
mortgage
mortgage
Total
By delinquency status:
Current-29 DPD
$
25,693
268
25,961
29,297
436
29,733
30-59 DPD
3,272
20
3,292
3,586
30
3,616
60-89 DPD
1,433
9
1,442
1,364
17
1,381
90-119 DPD
791
8
799
881
13
894
120-179 DPD
1,169
10
1,179
1,346
19
1,365
180+ DPD
5,921
150
6,071
7,214
220
7,434
Total consumer PCI loans (adjusted unpaid principal balance)
$
38,279
465
38,744
43,688
735
44,423
Total consumer PCI loans (carrying value)
$
29,746
206
29,952
33,245
250
33,495
157