Wells Fargo 2011 Annual Report Download - page 34
Download and view the complete annual report
Please find page 34 of the 2011 Wells Fargo annual report below. You can navigate through the pages in the report by either clicking on the pages listed below, or by using the keyword search tool below to find specific information within the annual report.-
 1
1 -
2
-
3
-
4
-
5
-
6
-
7
-
8
-
9
-
10
-
11
-
12
-
13
-
14
-
15
-
16
-
17
-
18
-
19
-
20
-
21
-
22
-
23
-
 24
24 -
 25
25 -
 26
26 -
 27
27 -
 28
28 -
 29
29 -
 30
30 -
 31
31 -
 32
32 -
 33
33 -
 34
34 -
 35
35 -
 36
36 -
 37
37 -
 38
38 -
 39
39 -
 40
40 -
 41
41 -
 42
42 -
 43
43 -
 44
44 -
45
-
46
-
47
-
48
-
49
-
50
-
51
-
52
-
53
-
54
-
55
-
56
-
57
-
58
-
59
-
60
-
61
-
62
-
63
-
64
-
65
-
66
-
67
-
68
-
69
-
70
-
71
-
72
-
73
-
74
-
75
-
76
-
77
-
78
-
79
-
80
-
81
-
82
-
83
-
84
-
85
-
86
-
87
-
88
-
89
-
90
-
91
-
92
-
93
-
94
-
95
-
96
-
97
-
98
-
99
-
100
-
101
-
102
-
103
-
104
-
105
-
106
-
107
-
108
-
109
-
110
-
111
-
112
-
113
-
114
-
115
-
116
-
117
-
118
-
119
-
120
-
121
-
122
-
123
-
124
-
125
-
126
-
127
-
128
-
129
-
130
-
131
-
132
-
133
-
134
-
135
-
136
-
137
-
138
-
139
-
140
-
141
-
142
-
143
-
144
-
145
-
146
-
147
-
148
-
149
-
150
-
151
-
152
-
153
-
154
-
155
-
156
-
157
-
158
-
159
-
160
-
161
-
162
-
163
-
164
-
165
-
166
-
167
-
168
-
169
-
170
-
171
-
172
-
173
-
174
-
175
-
176
-
177
-
178
-
179
-
180
-
181
-
182
-
183
-
184
-
185
-
186
-
187
-
188
-
189
-
190
-
191
-
192
-
193
-
194
-
195
-
196
-
197
-
198
-
199
-
200
-
201
-
202
-
203
-
204
-
205
-
206
-
207
-
208
-
209
-
210
-
211
-
212
-
213
-
214
-
215
-
216
-
217
-
218
-
219
-
220
-
221
-
222
-
223
-
224
-
225
-
226
-
227
-
228
-
229
-
230
-
231
-
232
-
233
-
234
-
235
-
236
-
237
-
238
-
239
-
240
 |
 |
Earnings Performance (continued)
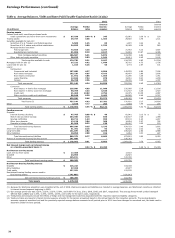
Net Interest Income
Net interest income is the interest earned on debt securities,
loans (including yield-related loan fees) and other interest-
earning assets minus the interest paid for deposits, short-term
borrowings and long-term debt. The net interest margin is the
average yield on earning assets minus the average interest rate
paid for deposits and our other sources of funding. Net interest
income and the net interest margin are presented on a taxable-
equivalent basis in Table 5 to consistently reflect income from
taxable and tax-exempt loans and securities based on a
35% federal statutory tax rate.
Net interest income and the net interest margin are
significantly influenced by the mix and overall size of our
earning asset portfolio and the cost of funding those assets. In
addition, some sources of interest income, such as loan
prepayment fees and collection of interest on nonaccrual loans,
can vary from period to period. Net interest income on a taxable-
equivalent basis was $43.5 billion in 2011, compared with
$45.4 billion in 2010 and $47.0 billion in 2009. The net interest
margin was 3.94% in 2011, down 32 basis points from 4.26% in
2010 and down 34 basis points from 4.28% in 2009. The decline
in net interest income and the net interest margin was largely
due to repricing of the balance sheet as higher-yielding loan and
security runoff was partially offset by new loans, investment
portfolio purchases and growth in short-term investments. The
decline in earning asset income was mitigated by a reduction in
funding costs resulting from disciplined deposit pricing, debt
maturities, and redemptions of higher cost trust preferred
securities.
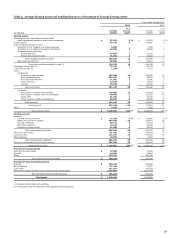
Table 4 presents the components of earning assets and
funding sources as a percentage of earning assets and provides
an analysis of year-over-year changes that influenced net interest
income.
Soft consumer loan demand and the impact of liquidating
certain loan portfolios reduced average loans in 2011 to 69% of
average earning assets compared with 72% in 2010. Average
short-term investments and trading account assets were 12% of
earning assets in 2011 up from 9% in 2010.
Core deposits are an important low-cost source of funding
and affect both net interest income and the net interest margin.
Core deposits include noninterest-bearing deposits, interest-
bearing checking, savings certificates, certain market rate and
other savings, and certain foreign deposits (Eurodollar sweep
balances). Average core deposits rose to $826.7 billion in 2011
from $772.0 billion in 2010 and funded 109% and 100% of
average loans, respectively. Average core deposits increased to
75% of average earning assets in 2011, compared with 73% a year
ago. The cost of these deposits declined significantly as the mix
shifted from higher cost certificates of deposit to checking and
savings products, which were also at lower yields relative to
2010. About 91% of our average core deposits are in checking
and savings deposits, one of the highest percentages in the
industry.
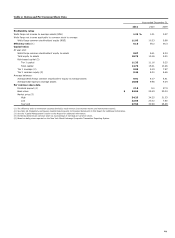
Table 5 presents the individual components of net interest
income and the net interest margin. The effect on interest
income and costs of earning asset and funding mix changes
described above, combined with rate changes during 2011, are
analyzed in Table 6.
32