Wells Fargo 2011 Annual Report Download - page 148
Download and view the complete annual report
Please find page 148 of the 2011 Wells Fargo annual report below. You can navigate through the pages in the report by either clicking on the pages listed below, or by using the keyword search tool below to find specific information within the annual report.-
 1
1 -
2
-
3
-
4
-
5
-
6
-
7
-
8
-
9
-
10
-
11
-
12
-
13
-
14
-
15
-
16
-
17
-
18
-
19
-
20
-
21
-
22
-
23
-
24
-
25
-
26
-
27
-
28
-
29
-
30
-
31
-
32
-
33
-
34
-
35
-
36
-
37
-
38
-
39
-
40
-
41
-
42
-
43
-
44
-
45
-
46
-
47
-
48
-
49
-
50
-
51
-
52
-
53
-
54
-
55
-
56
-
57
-
58
-
59
-
60
-
61
-
62
-
63
-
64
-
65
-
66
-
67
-
68
-
69
-
70
-
71
-
72
-
73
-
74
-
75
-
76
-
77
-
78
-
79
-
80
-
81
-
82
-
83
-
84
-
85
-
86
-
87
-
88
-
89
-
90
-
91
-
92
-
93
-
94
-
95
-
96
-
97
-
98
-
99
-
100
-
101
-
102
-
103
-
104
-
105
-
106
-
107
-
108
-
109
-
110
-
111
-
112
-
113
-
114
-
115
-
116
-
117
-
118
-
119
-
120
-
121
-
122
-
123
-
124
-
125
-
126
-
127
-
128
-
129
-
130
-
131
-
132
-
133
-
134
-
135
-
136
-
137
-
 138
138 -
 139
139 -
 140
140 -
 141
141 -
 142
142 -
 143
143 -
 144
144 -
 145
145 -
 146
146 -
 147
147 -
 148
148 -
 149
149 -
 150
150 -
 151
151 -
 152
152 -
 153
153 -
 154
154 -
 155
155 -
 156
156 -
 157
157 -
 158
158 -
159
-
160
-
161
-
162
-
163
-
164
-
165
-
166
-
167
-
168
-
169
-
170
-
171
-
172
-
173
-
174
-
175
-
176
-
177
-
178
-
179
-
180
-
181
-
182
-
183
-
184
-
185
-
186
-
187
-
188
-
189
-
190
-
191
-
192
-
193
-
194
-
195
-
196
-
197
-
198
-
199
-
200
-
201
-
202
-
203
-
204
-
205
-
206
-
207
-
208
-
209
-
210
-
211
-
212
-
213
-
214
-
215
-
216
-
217
-
218
-
219
-
220
-
221
-
222
-
223
-
224
-
225
-
226
-
227
-
228
-
229
-
230
-
231
-
232
-
233
-
234
-
235
-
236
-
237
-
238
-
239
-
240
 |
 |

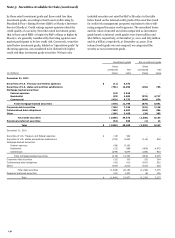
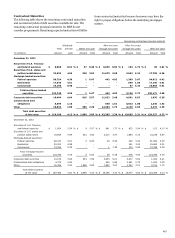
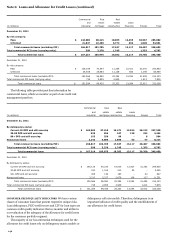
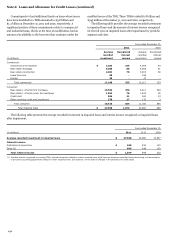
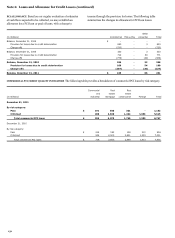
Note 6: Loans and Allowance for Credit Losses (continued)
Commercial
Real
Real
and
estate
estate
Lease
(in millions)
industrial
mortgage
construction
financing
Foreign
Total
December 31, 2011
By risk category:
Pass
$
144,980
80,215
10,865
12,455
36,567
285,082
Criticized
21,837
22,490
6,772
662
1,840
53,601
Total commercial loans (excluding PCI)
166,817
102,705
17,637
13,117
38,407
338,683
Total commercial PCI loans (carrying value)
399
3,270
1,745
-
1,353
6,767
Total commercial loans
$
167,216
105,975
19,382
13,117
39,760
345,450
December 31, 2010
By risk category:
Pass
$
126,058
70,597
11,256
12,411
30,341
250,663
Criticized
24,508
25,983
11,128
683
1,158
63,460
Total commercial loans (excluding PCI)
150,566
96,580
22,384
13,094
31,499
314,123
Total commercial PCI loans (carrying value)
718
2,855
2,949
-
1,413
7,935
Total commercial loans
$
151,284
99,435
25,333
13,094
32,912
322,058
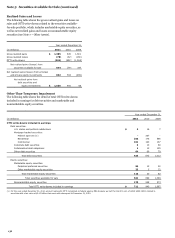
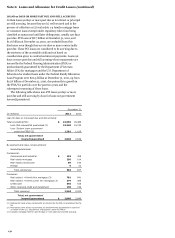
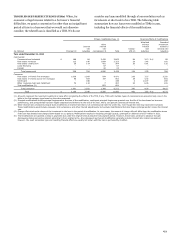
The following table provides past due information for
commercial loans, which we monitor as part of our credit risk
management practices.
Commercial
Real
Real
and
estate
estate
Lease
(in millions)
industrial
mortgage
construction
financing
Foreign
Total
December 31, 2011
By delinquency status:
Current-29 DPD and still accruing
$
163,583
97,410
15,471
12,934
38,122
327,520
30-89 DPD and still accruing
939
954
187
130
232
2,442
90+ DPD and still accruing
153
256
89
-
6
504
Nonaccrual loans
2,142
4,085
1,890
53
47
8,217
Total commercial loans (excluding PCI)
166,817
102,705
17,637
13,117
38,407
338,683
Total commercial PCI loans (carrying value)
399
3,270
1,745
-
1,353
6,767
Total commercial loans
$
167,216
105,975
19,382
13,117
39,760
345,450
December 31, 2010
By delinquency status:
Current-29 DPD and still accruing
$
146,135
90,233
19,005
12,927
31,350
299,650
30-89 DPD and still accruing
910
1,016
510
59
-
2,495
90+ DPD and still accruing
308
104
193
-
22
627
Nonaccrual loans
3,213
5,227
2,676
108
127
11,351
Total commercial loans (excluding PCI)
150,566
96,580
22,384
13,094
31,499
314,123
Total commercial PCI loans (carrying value)
718
2,855
2,949
-
1,413
7,935
Total commercial loans
$
151,284
99,435
25,333
13,094
32,912
322,058
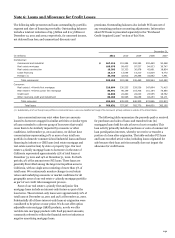
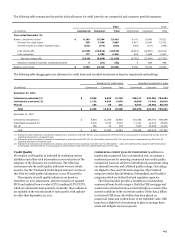
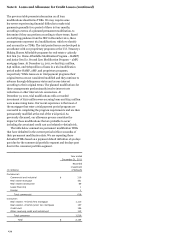
CONSUMER CREDIT QUALITY INDICATORS
We have various
classes of consumer loans that present respective unique risks.
Loan delinquency, FICO credit scores and LTV for loan types are
common credit quality indicators that we monitor and utilize in
our evaluation of the adequacy of the allowance for credit losses
for the consumer portfolio segment.
The majority of our loss estimation techniques used for the
allowance for credit losses rely on delinquency matrix models or
delinquency roll rate models. Therefore, delinquency is an
important indicator of credit quality and the establishment of
our allowance for credit losses.
146