Wells Fargo 2011 Annual Report Download - page 157
Download and view the complete annual report
Please find page 157 of the 2011 Wells Fargo annual report below. You can navigate through the pages in the report by either clicking on the pages listed below, or by using the keyword search tool below to find specific information within the annual report.-
 1
1 -
2
-
3
-
4
-
5
-
6
-
7
-
8
-
9
-
10
-
11
-
12
-
13
-
14
-
15
-
16
-
17
-
18
-
19
-
20
-
21
-
22
-
23
-
24
-
25
-
26
-
27
-
28
-
29
-
30
-
31
-
32
-
33
-
34
-
35
-
36
-
37
-
38
-
39
-
40
-
41
-
42
-
43
-
44
-
45
-
46
-
47
-
48
-
49
-
50
-
51
-
52
-
53
-
54
-
55
-
56
-
57
-
58
-
59
-
60
-
61
-
62
-
63
-
64
-
65
-
66
-
67
-
68
-
69
-
70
-
71
-
72
-
73
-
74
-
75
-
76
-
77
-
78
-
79
-
80
-
81
-
82
-
83
-
84
-
85
-
86
-
87
-
88
-
89
-
90
-
91
-
92
-
93
-
94
-
95
-
96
-
97
-
98
-
99
-
100
-
101
-
102
-
103
-
104
-
105
-
106
-
107
-
108
-
109
-
110
-
111
-
112
-
113
-
114
-
115
-
116
-
117
-
118
-
119
-
120
-
121
-
122
-
123
-
124
-
125
-
126
-
127
-
128
-
129
-
130
-
131
-
132
-
133
-
134
-
135
-
136
-
137
-
138
-
139
-
140
-
141
-
142
-
143
-
144
-
145
-
146
-
 147
147 -
 148
148 -
 149
149 -
 150
150 -
 151
151 -
 152
152 -
 153
153 -
 154
154 -
 155
155 -
 156
156 -
 157
157 -
 158
158 -
 159
159 -
 160
160 -
 161
161 -
 162
162 -
 163
163 -
 164
164 -
 165
165 -
 166
166 -
 167
167 -
168
-
169
-
170
-
171
-
172
-
173
-
174
-
175
-
176
-
177
-
178
-
179
-
180
-
181
-
182
-
183
-
184
-
185
-
186
-
187
-
188
-
189
-
190
-
191
-
192
-
193
-
194
-
195
-
196
-
197
-
198
-
199
-
200
-
201
-
202
-
203
-
204
-
205
-
206
-
207
-
208
-
209
-
210
-
211
-
212
-
213
-
214
-
215
-
216
-
217
-
218
-
219
-
220
-
221
-
222
-
223
-
224
-
225
-
226
-
227
-
228
-
229
-
230
-
231
-
232
-
233
-
234
-
235
-
236
-
237
-
238
-
239
-
240
 |
 |
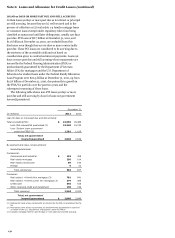
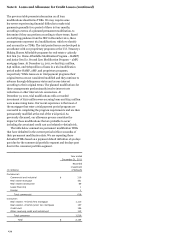
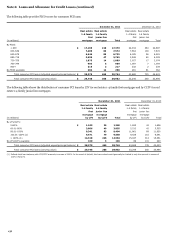
Purchased Credit-Impaired Loans
Substantially all of our PCI loans were acquired from Wachovia
on December 31, 2008. The following table presents PCI loans
net of any remaining purchase accounting adjustments.
December 31,
(in millions)
2011
2010
2009
2008
Commercial:
Commercial and industrial
$
399
718
1,911
4,580
Real estate mortgage
3,270
2,855
4,137
5,803
Real estate construction
1,745
2,949
5,207
6,462
Foreign
1,353
1,413
1,733
1,859
Total commercial
6,767
7,935
12,988
18,704
Consumer:
Real estate 1-4 family first mortgage
29,746
33,245
38,386
39,214
Real estate 1-4 family junior lien mortgage
206
250
331
728
Other revolving credit and installment
-
-
-
151
Total consumer
29,952
33,495
38,717
40,093
Total PCI loans (carrying value)
$
36,719
41,430
51,705
58,797
Total PCI loans (unpaid principal balance)
$
55,312
64,331
83,615
98,182
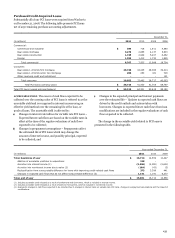
ACCRETABLE YIELD
The excess of cash flows expected to be
collected over the carrying value of PCI loans is referred to as the
accretable yield and is recognized in interest income using an
effective yield method over the remaining life of the loan, or
pools of loans. The accretable yield is affected by:
Changes in interest rate indices for variable rate PCI loans –
Expected future cash flows are based on the variable rates in
effect at the time of the regular evaluations of cash flows
expected to be collected;
Changes in prepayment assumptions – Prepayments affect
the estimated life of PCI loans which may change the
amount of interest income, and possibly principal, expected
to be collected; and
Changes in the expected principal and interest payments
over the estimated life – Updates to expected cash flows are
driven by the credit outlook and actions taken with
borrowers. Changes in expected future cash flows from loan
modifications are included in the regular evaluations of cash
flows expected to be collected.
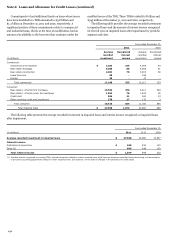
The change in the accretable yield related to PCI loans is
presented in the following table.
Year ended December 31,
(in millions)
2011
2010
2009
Total, beginning of year
$
16,714
14,559
10,447
Addition of accretable yield due to acquisitions
128
-
-
Accretion into interest income (1)
(2,206)
(2,392)
(2,601)
Accretion into noninterest income due to sales (2)
(189)
(43)
(5)
Reclassification from nonaccretable difference for loans with improving credit-related cash flows
373
3,399
441
Changes in expected cash flows that do not affect nonaccretable difference (3)
1,141
1,191
6,277
Total, end of year
$
15,961
16,714
14,559
(1) Includes accretable yield released as a result of settlements with borrowers, which is included in interest income.
(2) Includes accretable yield released as a result of sales to third parties, which is included in noninterest income.
(3) Represents changes in cash flows expected to be collected due to changes in interest rates on variable rate PCI loans, changes in prepayment assumptions and the impact of
modifications.
155