Wells Fargo 2011 Annual Report Download - page 53
Download and view the complete annual report
Please find page 53 of the 2011 Wells Fargo annual report below. You can navigate through the pages in the report by either clicking on the pages listed below, or by using the keyword search tool below to find specific information within the annual report.-
 1
1 -
2
-
3
-
4
-
5
-
6
-
7
-
8
-
9
-
10
-
11
-
12
-
13
-
14
-
15
-
16
-
17
-
18
-
19
-
20
-
21
-
22
-
23
-
24
-
25
-
26
-
27
-
28
-
29
-
30
-
31
-
32
-
33
-
34
-
35
-
36
-
37
-
38
-
39
-
40
-
41
-
42
-
 43
43 -
 44
44 -
 45
45 -
 46
46 -
 47
47 -
 48
48 -
 49
49 -
 50
50 -
 51
51 -
 52
52 -
 53
53 -
 54
54 -
 55
55 -
 56
56 -
 57
57 -
 58
58 -
 59
59 -
 60
60 -
 61
61 -
 62
62 -
 63
63 -
64
-
65
-
66
-
67
-
68
-
69
-
70
-
71
-
72
-
73
-
74
-
75
-
76
-
77
-
78
-
79
-
80
-
81
-
82
-
83
-
84
-
85
-
86
-
87
-
88
-
89
-
90
-
91
-
92
-
93
-
94
-
95
-
96
-
97
-
98
-
99
-
100
-
101
-
102
-
103
-
104
-
105
-
106
-
107
-
108
-
109
-
110
-
111
-
112
-
113
-
114
-
115
-
116
-
117
-
118
-
119
-
120
-
121
-
122
-
123
-
124
-
125
-
126
-
127
-
128
-
129
-
130
-
131
-
132
-
133
-
134
-
135
-
136
-
137
-
138
-
139
-
140
-
141
-
142
-
143
-
144
-
145
-
146
-
147
-
148
-
149
-
150
-
151
-
152
-
153
-
154
-
155
-
156
-
157
-
158
-
159
-
160
-
161
-
162
-
163
-
164
-
165
-
166
-
167
-
168
-
169
-
170
-
171
-
172
-
173
-
174
-
175
-
176
-
177
-
178
-
179
-
180
-
181
-
182
-
183
-
184
-
185
-
186
-
187
-
188
-
189
-
190
-
191
-
192
-
193
-
194
-
195
-
196
-
197
-
198
-
199
-
200
-
201
-
202
-
203
-
204
-
205
-
206
-
207
-
208
-
209
-
210
-
211
-
212
-
213
-
214
-
215
-
216
-
217
-
218
-
219
-
220
-
221
-
222
-
223
-
224
-
225
-
226
-
227
-
228
-
229
-
230
-
231
-
232
-
233
-
234
-
235
-
236
-
237
-
238
-
239
-
240
 |
 |

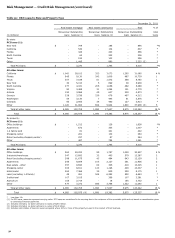
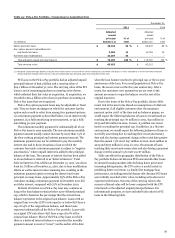
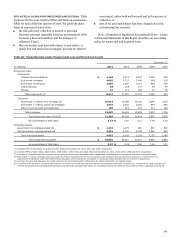
COMMERCIAL AND INDUSTRIAL LOANS AND LEASE
FINANCING
For purposes of portfolio risk management, we
aggregate commercial and industrial loans and lease financing
according to market segmentation and standard industry
codes. Table 21 summarizes commercial and industrial loans and
lease financing by industry with the related nonaccrual totals.
Across our non-PCI commercial loans and leases, the
commercial and industrial loans and lease financing portfolio
generally experienced better credit improvement than our CRE
portfolios in 2011. Of the total commercial and industrial loans
and lease financing non-PCI portfolio, 0.09% was 90 days or
more past due and still accruing, 1.22% was nonaccruing and
12.5% was criticized. In comparison, of the total non-PCI CRE
portfolio, 0.29% was 90 days or more past due and still accruing,
4.97% was nonaccruing and 24.3% was criticized. Also, the net
charge-off rate for both portfolios declined in 2011 from 2010.
We believe the commercial and industrial loans and lease
financing portfolio is well underwritten and is diverse in its risk
with relatively level concentrations across several industries. Our
credit risk management process for this portfolio primarily
focuses on a customer’s ability to repay the loan through their
cash flow.
A majority of our commercial and industrial loans and lease
financing portfolio is secured by short-term liquid assets, such as
accounts receivable, inventory and securities, as well as long-
lived assets, such as equipment and other business assets.
Generally, the collateral securing this portfolio represents a
secondary source of repayment. See Note 6 (Loans and
Allowance for Credit Losses) to Financial Statements in this
Report for more analysis and credit metric information.
Table 21: Commercial and Industrial Loans and Lease
Financing by Industry
December 31, 2011
% of
Nonaccrual
Outstanding
total
(in millions)
loans
balance (1)
loans
PCI loans (1):
Technology
$
-
65
*
%
Investors
-
49
*
Healthcare
-
39
*
Insurance
-
38
*
Aerospace and defense
-
36
*
Residential construction
-
26
*
Other
-
146
(2)
*
Total PCI loans
$
-
399
*
%
All other loans:
Financial institutions
$
146
13,597
2
%
Cyclical retailers
41
10,364
1
Oil and gas
89
10,198
1
Food and beverage
36
10,150
1
Healthcare
78
8,419
1
Investors
2
8,407
1
Industrial equipment
97
7,365
*
Technology
66
6,404
*
Business services
42
6,377
*
Transportation
17
6,260
*
Real estate lessor
44
6,067
*
Utilities
1
5,357
*
Other
1,536
80,969
(3)
11
Total all other loans
$
2,195
179,934
23
%
Total
$
2,195
180,333
23
%
* Less than 1%.
(1) For PCI loans, amounts represent carrying value. PCI loans are considered to be
accruing due to the existence of the accretable yield and not based on
consideration given to contractual interest payments.
(2) No other single category had loans in excess of $24 million.
(3) No other single category had loans in excess of $4.9 billion.
51