Wells Fargo 2011 Annual Report Download - page 195
Download and view the complete annual report
Please find page 195 of the 2011 Wells Fargo annual report below. You can navigate through the pages in the report by either clicking on the pages listed below, or by using the keyword search tool below to find specific information within the annual report.-
 1
1 -
2
-
3
-
4
-
5
-
6
-
7
-
8
-
9
-
10
-
11
-
12
-
13
-
14
-
15
-
16
-
17
-
18
-
19
-
20
-
21
-
22
-
23
-
24
-
25
-
26
-
27
-
28
-
29
-
30
-
31
-
32
-
33
-
34
-
35
-
36
-
37
-
38
-
39
-
40
-
41
-
42
-
43
-
44
-
45
-
46
-
47
-
48
-
49
-
50
-
51
-
52
-
53
-
54
-
55
-
56
-
57
-
58
-
59
-
60
-
61
-
62
-
63
-
64
-
65
-
66
-
67
-
68
-
69
-
70
-
71
-
72
-
73
-
74
-
75
-
76
-
77
-
78
-
79
-
80
-
81
-
82
-
83
-
84
-
85
-
86
-
87
-
88
-
89
-
90
-
91
-
92
-
93
-
94
-
95
-
96
-
97
-
98
-
99
-
100
-
101
-
102
-
103
-
104
-
105
-
106
-
107
-
108
-
109
-
110
-
111
-
112
-
113
-
114
-
115
-
116
-
117
-
118
-
119
-
120
-
121
-
122
-
123
-
124
-
125
-
126
-
127
-
128
-
129
-
130
-
131
-
132
-
133
-
134
-
135
-
136
-
137
-
138
-
139
-
140
-
141
-
142
-
143
-
144
-
145
-
146
-
147
-
148
-
149
-
150
-
151
-
152
-
153
-
154
-
155
-
156
-
157
-
158
-
159
-
160
-
161
-
162
-
163
-
164
-
165
-
166
-
167
-
168
-
169
-
170
-
171
-
172
-
173
-
174
-
175
-
176
-
177
-
178
-
179
-
180
-
181
-
182
-
183
-
184
-
 185
185 -
 186
186 -
 187
187 -
 188
188 -
 189
189 -
 190
190 -
 191
191 -
 192
192 -
 193
193 -
 194
194 -
 195
195 -
 196
196 -
 197
197 -
 198
198 -
 199
199 -
 200
200 -
 201
201 -
 202
202 -
 203
203 -
 204
204 -
 205
205 -
206
-
207
-
208
-
209
-
210
-
211
-
212
-
213
-
214
-
215
-
216
-
217
-
218
-
219
-
220
-
221
-
222
-
223
-
224
-
225
-
226
-
227
-
228
-
229
-
230
-
231
-
232
-
233
-
234
-
235
-
236
-
237
-
238
-
239
-
240
 |
 |
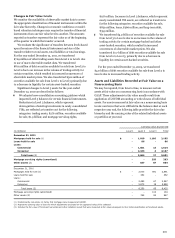
MORTGAGE SERVICING RIGHTS (MSRs) AND CERTAIN OTHER
INTERESTS HELD IN SECURITIZATIONS
MSRs and certain
other interests held in securitizations (e.g., interest-only strips)
do not trade in an active market with readily observable prices.
Accordingly, we determine the fair value of MSRs using a
valuation model that calculates the present value of estimated
future net servicing income cash flows. The model incorporates
assumptions that market participants use in estimating future
net servicing income cash flows, including estimates of
prepayment speeds (including housing price volatility), discount
rate, default rates, cost to service (including delinquency and
foreclosure costs), escrow account earnings, contractual
servicing fee income, ancillary income and late fees. Commercial
MSRs and certain residential MSRs are carried at lower of cost
or market value, and therefore can be subject to fair value
measurements on a nonrecurring basis. Changes in the fair value
of MSRs occur primarily due to the collection/realization of
expected cash flows, as well as changes in valuation inputs and
assumptions. For other interests held in securitizations (such as
interest-only strips) we use a valuation model that calculates the
present value of estimated future cash flows. The model
incorporates our own estimates of assumptions market
participants use in determining the fair value, including
estimates of prepayment speeds, discount rates, defaults and
contractual fee income. Interest-only strips are recorded as
trading assets. Our valuation approach is validated by our
internal valuation model validation group and our valuation
estimates are periodically benchmarked to independent
appraisals. Fair value measurements of our MSRs and interest-
only strips use significant unobservable inputs and, accordingly,
we classify as Level 3.
FORECLOSED ASSETS
Foreclosed assets are carried at net
realizable value, which represents fair value less estimated costs
to sell. Fair value is generally based upon independent market
prices or appraised values of the collateral and, accordingly, we
classify foreclosed assets as Level 2.
NONMARKETABLE EQUITY INVESTMENTS
Nonmarketable
equity investments are generally recorded under the cost or
equity method of accounting. There are generally restrictions on
the sale and/or liquidation of these investments, including
federal bank stock. Federal bank stock carrying value
approximates fair value. We use facts and circumstances
available to estimate the fair value of our nonmarketable equity
investments. We typically consider our access to and need for
capital (including recent or projected financing activity),
qualitative assessments of the viability of the investee, evaluation
of the financial statements of the investee and prospects for its
future. Public equity investments are valued using quoted
market prices and discounts are only applied when there are
trading restrictions that are an attribute of the investment. We
estimate the fair value of investments in non-public securities
using metrics such as security prices of comparable public
companies, acquisition prices for similar companies and original
investment purchase price multiples, while also incorporating a
portfolio company's financial performance and specific factors.
For investments in private equity funds, we use the NAV
provided by the fund sponsor as an appropriate measure of fair
value. In some cases, such NAVs require adjustments based on
certain unobservable inputs.
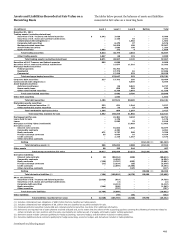
Liabilities
DEPOSIT LIABILITIES
Deposit liabilities are carried at historical
cost. The fair value of deposits with no stated maturity, such as
noninterest-bearing demand deposits, interest-bearing checking,
and market rate and other savings, is equal to the amount
payable on demand at the measurement date. The fair value of
other time deposits is calculated based on the discounted value
of contractual cash flows. The discount rate is estimated using
the rates currently offered for like wholesale deposits with
similar remaining maturities.
SHORT-TERM FINANCIAL LIABILITIES
Short-term financial
liabilities are carried at historical cost and include federal funds
purchased and securities sold under repurchase agreements,
commercial paper and other short-term borrowings. The
carrying amount is a reasonable estimate of fair value because of
the relatively short time between the origination of the
instrument and its expected realization.
OTHER LIABILITIES
Other liabilities recorded at fair value on a
recurring basis, excluding derivative liabilities (see the
“Derivatives” section for derivative liabilities), includes
primarily short sale liabilities. Short sale liabilities are classified
as either Level 1 or Level 2, generally dependent upon whether
the underlying securities have readily obtainable quoted prices
in active exchange markets.
LONG-TERM DEBT
Long-term debt is generally carried at
amortized cost. For disclosure, we are required to estimate the
fair value of long-term debt. Generally, the discounted cash flow
method is used to estimate the fair value of our long-term debt.
Contractual cash flows are discounted using rates currently
offered for new notes with similar remaining maturities and, as
such, these discount rates include our current spread levels.
193