Wells Fargo 2011 Annual Report Download - page 58
Download and view the complete annual report
Please find page 58 of the 2011 Wells Fargo annual report below. You can navigate through the pages in the report by either clicking on the pages listed below, or by using the keyword search tool below to find specific information within the annual report.-
 1
1 -
2
-
3
-
4
-
5
-
6
-
7
-
8
-
9
-
10
-
11
-
12
-
13
-
14
-
15
-
16
-
17
-
18
-
19
-
20
-
21
-
22
-
23
-
24
-
25
-
26
-
27
-
28
-
29
-
30
-
31
-
32
-
33
-
34
-
35
-
36
-
37
-
38
-
39
-
40
-
41
-
42
-
43
-
44
-
45
-
46
-
47
-
 48
48 -
 49
49 -
 50
50 -
 51
51 -
 52
52 -
 53
53 -
 54
54 -
 55
55 -
 56
56 -
 57
57 -
 58
58 -
 59
59 -
 60
60 -
 61
61 -
 62
62 -
 63
63 -
 64
64 -
 65
65 -
 66
66 -
 67
67 -
 68
68 -
69
-
70
-
71
-
72
-
73
-
74
-
75
-
76
-
77
-
78
-
79
-
80
-
81
-
82
-
83
-
84
-
85
-
86
-
87
-
88
-
89
-
90
-
91
-
92
-
93
-
94
-
95
-
96
-
97
-
98
-
99
-
100
-
101
-
102
-
103
-
104
-
105
-
106
-
107
-
108
-
109
-
110
-
111
-
112
-
113
-
114
-
115
-
116
-
117
-
118
-
119
-
120
-
121
-
122
-
123
-
124
-
125
-
126
-
127
-
128
-
129
-
130
-
131
-
132
-
133
-
134
-
135
-
136
-
137
-
138
-
139
-
140
-
141
-
142
-
143
-
144
-
145
-
146
-
147
-
148
-
149
-
150
-
151
-
152
-
153
-
154
-
155
-
156
-
157
-
158
-
159
-
160
-
161
-
162
-
163
-
164
-
165
-
166
-
167
-
168
-
169
-
170
-
171
-
172
-
173
-
174
-
175
-
176
-
177
-
178
-
179
-
180
-
181
-
182
-
183
-
184
-
185
-
186
-
187
-
188
-
189
-
190
-
191
-
192
-
193
-
194
-
195
-
196
-
197
-
198
-
199
-
200
-
201
-
202
-
203
-
204
-
205
-
206
-
207
-
208
-
209
-
210
-
211
-
212
-
213
-
214
-
215
-
216
-
217
-
218
-
219
-
220
-
221
-
222
-
223
-
224
-
225
-
226
-
227
-
228
-
229
-
230
-
231
-
232
-
233
-
234
-
235
-
236
-
237
-
238
-
239
-
240
 |
 |

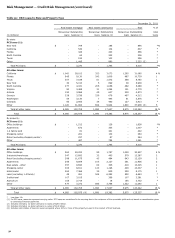
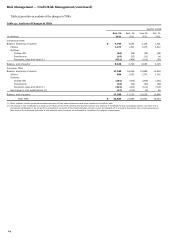
Risk Management — Credit Risk Management (continued)
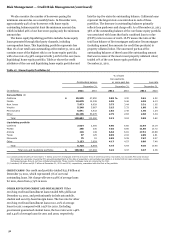
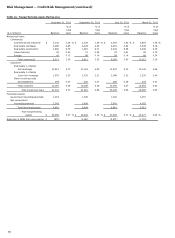
Table 25: Pick-a-Pay Portfolio (1)
December 31, 2011
PCI loans
All other loans
Ratio of
Ratio of
Adjusted
carrying
carrying
unpaid
Current
value to
value to
principal
LTV
Carrying
current
Carrying
current
(in millions)
balance (2)
ratio (3)
value (4)
value (5)
value (4)
value (5)
California
$
25,036
121
%
$
19,269
93
%
$
17,870
86
%
Florida
3,325
122
2,562
89
3,760
100
New Jersey
1,336
92
1,224
84
2,321
79
New York
757
95
685
84
1,013
82
Texas
340
78
312
72
1,487
64
Other states
6,111
110
5,004
89
10,145
87
Total Pick-a-Pay loans
$
36,905
$
29,056
$
36,596
(1)
The individual states shown in this table represent the top five states based on the total net carrying value of the Pick-a-Pay loans at the beginning of 2011.
(2)
Adjusted unpaid principal balance includes write-downs taken on loans where severe delinquency (normally 180 days) or other indications of severe borrower financial
stress exist that indicate there will be a loss of contractually due amounts upon final resolution of the loan.
(3)
The current LTV ratio is calculated as the adjusted unpaid principal balance divided by the collateral value. Collateral values are generally determined using automated
valuation models (AVM) and are updated quarterly. AVMs are computer
-based tools used to estimate market values of homes based on processing large volumes of
market data including market comparables and price trends for local market areas.
(4)
Carrying value, which does not reflect the allowance for loan losses, includes remaining purchase accounting adjustments, which, for PCI loans may include the
nonaccretable difference and the accretable yield and, for all other loans,
an adjustment to mark the loans to a market yield at date of merger less any subsequent
charge-offs.
(5)
The ratio of carrying value to current value is calculated as the carrying value divided by the collateral value.
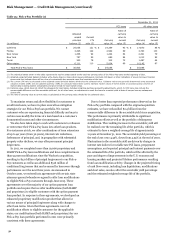
To maximize return and allow flexibility for customers to
avoid foreclosure, we have in place several loss mitigation
strategies for our Pick-a-Pay loan portfolio. We contact
customers who are experiencing financial difficulty and may in
certain cases modify the terms of a loan based on a customer’s
documented income and other circumstances.
We also have taken steps to work with customers to refinance
or restructure their Pick-a-Pay loans into other loan products.
For customers at risk, we offer combinations of term extensions
of up to 40 years (from 30 years), interest rate reductions,
forbearance of principal, and, in geographies with substantial
property value declines, we may offer permanent principal
forgiveness.
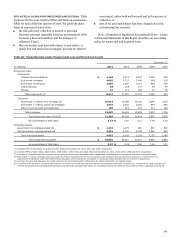
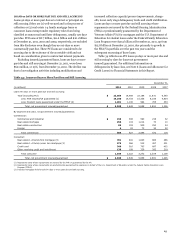
In 2011, we completed more than 19,000 proprietary and
HAMP Pick-a-Pay loan modifications and have completed more
than 99,000 modifications since the Wachovia acquisition,
resulting in $4.0 billion of principal forgiveness to our Pick-a-
Pay customers as well as an additional $516 million of
conditional forgiveness that can be earned by borrowers through
performance over the next three years. As announced in
October 2010, we entered into agreements with certain state
attorneys general whereby we agreed to offer loan modifications
to eligible Pick-a-Pay customers through June 2013. These
agreements cover the majority of our option payment loan
portfolio and require that we offer modifications (both HAMP
and proprietary) to eligible customers with the option payment
loan product. In response to these agreements, we developed an
enhanced proprietary modification product that allows for
various means of principal forgiveness along with changes to
other loan terms. Given that these agreements cover all
modification efforts to eligible customers for the applicable
states, our modifications (both HAMP and proprietary) for our
Pick-a-Pay loan portfolio performed in 2011 were primarily
consistent with these agreements.
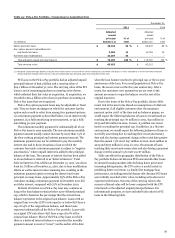
Due to better than expected performance observed on the
Pick-a-Pay portfolio compared with the original acquisition
estimates, we have reclassified $2.4 billion from the
nonaccretable difference to the accretable yield since acquisition.
This performance is primarily attributable to significant
modification efforts as well as the portfolio’s delinquency
stabilization. The resulting increase in the accretable yield will
be realized over the remaining life of the portfolio, which is
estimated to have a weighted-average life of approximately
11 years at December 31, 2011. The accretable yield percentage at
the end of 2011 was 4.45%, down from 4.54% at the end of 2010.
Fluctuations in the accretable yield are driven by changes in
interest rate indices for variable rate PCI loans, prepayment
assumptions, and expected principal and interest payments over
the estimated life of the portfolio, which will be affected by the
pace and degree of improvements in the U.S. economy and
housing markets and projected
lifetime performance resulting
from loan modification activity. Changes in the projected timing
of cash flow events, including loan liquidations, modifications
and short sales, can also affect the accretable yield percentage
and the estimated weighted-average life of the portfolio.
56