Wells Fargo 2011 Annual Report Download - page 151
Download and view the complete annual report
Please find page 151 of the 2011 Wells Fargo annual report below. You can navigate through the pages in the report by either clicking on the pages listed below, or by using the keyword search tool below to find specific information within the annual report.-
 1
1 -
2
-
3
-
4
-
5
-
6
-
7
-
8
-
9
-
10
-
11
-
12
-
13
-
14
-
15
-
16
-
17
-
18
-
19
-
20
-
21
-
22
-
23
-
24
-
25
-
26
-
27
-
28
-
29
-
30
-
31
-
32
-
33
-
34
-
35
-
36
-
37
-
38
-
39
-
40
-
41
-
42
-
43
-
44
-
45
-
46
-
47
-
48
-
49
-
50
-
51
-
52
-
53
-
54
-
55
-
56
-
57
-
58
-
59
-
60
-
61
-
62
-
63
-
64
-
65
-
66
-
67
-
68
-
69
-
70
-
71
-
72
-
73
-
74
-
75
-
76
-
77
-
78
-
79
-
80
-
81
-
82
-
83
-
84
-
85
-
86
-
87
-
88
-
89
-
90
-
91
-
92
-
93
-
94
-
95
-
96
-
97
-
98
-
99
-
100
-
101
-
102
-
103
-
104
-
105
-
106
-
107
-
108
-
109
-
110
-
111
-
112
-
113
-
114
-
115
-
116
-
117
-
118
-
119
-
120
-
121
-
122
-
123
-
124
-
125
-
126
-
127
-
128
-
129
-
130
-
131
-
132
-
133
-
134
-
135
-
136
-
137
-
138
-
139
-
140
-
 141
141 -
 142
142 -
 143
143 -
 144
144 -
 145
145 -
 146
146 -
 147
147 -
 148
148 -
 149
149 -
 150
150 -
 151
151 -
 152
152 -
 153
153 -
 154
154 -
 155
155 -
 156
156 -
 157
157 -
 158
158 -
 159
159 -
 160
160 -
 161
161 -
162
-
163
-
164
-
165
-
166
-
167
-
168
-
169
-
170
-
171
-
172
-
173
-
174
-
175
-
176
-
177
-
178
-
179
-
180
-
181
-
182
-
183
-
184
-
185
-
186
-
187
-
188
-
189
-
190
-
191
-
192
-
193
-
194
-
195
-
196
-
197
-
198
-
199
-
200
-
201
-
202
-
203
-
204
-
205
-
206
-
207
-
208
-
209
-
210
-
211
-
212
-
213
-
214
-
215
-
216
-
217
-
218
-
219
-
220
-
221
-
222
-
223
-
224
-
225
-
226
-
227
-
228
-
229
-
230
-
231
-
232
-
233
-
234
-
235
-
236
-
237
-
238
-
239
-
240
 |
 |

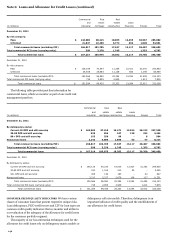
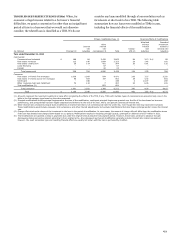
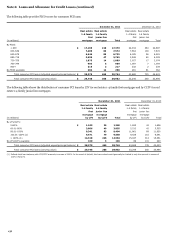
December 31, 2011
December 31, 2010 (1)
Real estate
Real estate
Real estate
Real estate
1-4 family
1-4 family
1-4 family
1-4 family
first
junior lien
first
junior lien
mortgage
mortgage
mortgage
mortgage
(in millions)
by LTV
by CLTV
Total
by LTV
by CLTV
Total
By LTV/CLTV:
0-60%
$
46,476
12,694
59,170
47,808
14,814
62,622
60.01-80%
46,831
15,722
62,553
42,542
17,744
60,286
80.01-100%
36,764
20,290
57,054
39,497
24,255
63,752
100.01-120% (2)
21,116
15,829
36,945
24,147
17,887
42,034
> 120% (2)
18,608
18,626
37,234
24,243
18,628
42,871
No LTV/CLTV available
2,798
2,624
5,422
3,239
2,571
5,810
Government insured/guaranteed loans (3)
26,555
-
26,555
15,514
-
15,514
Total consumer loans (excluding PCI)
199,148
85,785
284,933
196,990
95,899
292,889
Total consumer PCI loans (carrying value)
29,746
206
29,952
33,245
250
33,495
Total consumer loans
$
228,894
85,991
314,885
230,235
96,149
326,384
(1) Amounts at December 31, 2010, have been revised to conform to the current separate presentation of government insured/guaranteed loans.
(2) Reflects total loan balances with LTV/CLTV amounts in excess of 100%. In the event of default, the loss content would generally be limited to only the amount in excess of
100% LTV/CLTV.
(3) Represents loans whose repayments are insured by the FHA or guaranteed by the VA. In 2011, we consolidated $5.6 billion of previously sold FHA insured real estate 1-4
family reverse mortgages.
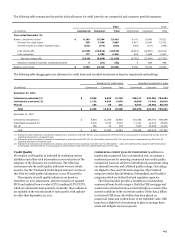
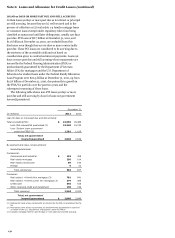
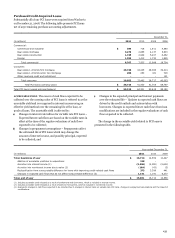
NONACCRUAL LOANS
The following table provides loans on
nonaccrual status. PCI loans are excluded from this table due to
the existence of the accretable yield.
December 31,
(in millions)
2011
2010
Commercial:
Commercial and industrial
$
2,142
3,213
Real estate mortgage
4,085
5,227
Real estate construction
1,890
2,676
Lease financing
53
108
Foreign
47
127
Total commercial (1)
8,217
11,351
Consumer:
Real estate 1-4 family first mortgage (2)
10,913
12,289
Real estate 1-4 family junior lien mortgage
1,975
2,302
Other revolving credit and installment
199
300
Total consumer
13,087
14,891
Total nonaccrual loans
(excluding PCI)
$
21,304
26,242
(1) Includes LHFS of $25 million and $3 million at December 31, 2011 and 2010,
respectively.
(2) Includes MHFS of $301 million and $426 million at December 31, 2011 and
2010, respectively.
149